|
|
Hello all! A lot has happened since my last post, so here is a brief update!
After returning to school with my phenology data and experimental seed heads in the fall of 2011, I began work on my senior thesis using that data as a foundation. In April of this year I defended my thesis, “Flowering Phenology and Seed Set in Fragmented Populations of the Prairie Plant Echinacea angustifolia” and was awarded Distinction by my committee! Stuart and I continued to work on my data after my defense and are planning to continue the project and potentially incorporate data from this summer in the hopes of publishing it! Here are some of the very interesting results that we’ve gotten so far:
> aggregate(ss ~ nndist + pdtime, data = mm, mean)
nndist pdtime ss
1 far early 0.1637403
2 near early 0.2690535
3 far late 0.2947009
4 near late 0.1802392
We found that there’s a relationship between seed set (ss), peak flowering date (pdtime), AND distance to the 6th nearest neighbor (nndist). Seed set was higher in plants that had a combination of close 6th nearest neighbor (near) and early peak flowering date or far 6th nearest neighbor (far) and late flowering date. Very interesting!
(table is categorical and matches glm model which looks at pd & nn6 as continuous)
If anyone has any questions, is interested in continuing this exciting project this summer, or would like a copy of my thesis, feel free to contact me! (Amber Zahler at ambermzahler@gmail.com)
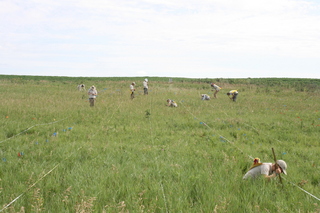
We finished measuring plants in Jennifer’s Phenology plot at Hegg Lake WMA this Friday.

We measured many plants.
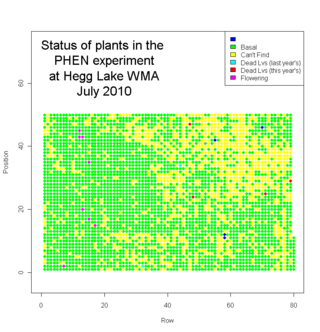
We measured about 2700 plants. Eight plants flowered this year. We visited another 1300 locations where we couldn’t find a plant (mostly because they had died). Here’s a map of the plot with the status of each location (click to see a bigger version)…

In addition to Echinacea angustifolia, we saw some good prairie plants in the plot, including lead plant (Amorpha canescens), yellow lady-slipper (Cypripedium calceolus), prairie rose (Rosa arkansana), Missouri goldenrod (Solidago missouriensis), silver leaf scurf pea (Psoralea argophylla), and many others.
It was a big job, but we were quite efficient. We laid out 50m tapes on every other row to help guide us. Four of us went out on Wednesday to flag positions 1 and 50 for all rows. That took ~2h. We started flagging positions 10, 20, but that was unnecessary. On Thursday we all went out and measured from 2-4 pm. On Friday we did two shifts: 10 -12 and 2:30 -5.
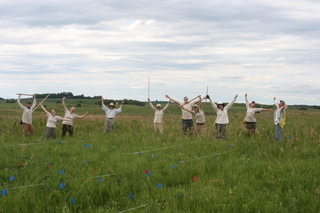
We were happy to be done.
On the way out we removed a weed that we had noticed the day before–spotted knapweed. We were careful not to touch it because it can be a skin irritant. I’d never seen this plant in the study area before.
Heading home.
What a great way to end the week. It was Katie and Laura’s last day. They are heading back to the Chicago Botanic Garden to prepare their posters and talks.
This afternoon we are going to measure plants in Jennifer’s Phenology plot at Hegg Lake WMA. Here is a script that makes a datasheet that assigns us rows to measure. The order is approximately 1 – 80, but they are slightly mixed up (just to keep us on our toes): measurePHENatHeggLakeRows.r
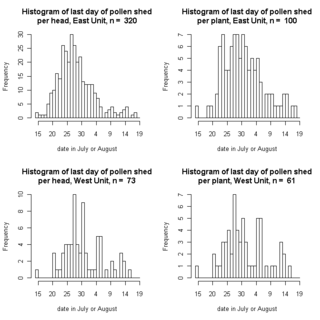
Echinacea plants on our transect at Staffanson Preserve are done shedding pollen for the year. A few still have persistent, receptive styles, but August 18th was the last day pollen was shed.
This graph show how many heads (left panels) or plants (right panels) finished on each day. The earliest heads finished on 15 July. I divided the preserve according to the burn unit: burned East (top panels) and unburned West (bottom panels):

Final date of flowering for 393 heads on 161 Echinacea plants
from a burned and unburned unit of a prairie preserve
This graph is based on preliminary, raw data, but I wanted to share. Click on the thumbnail to see a larger version of the graph.
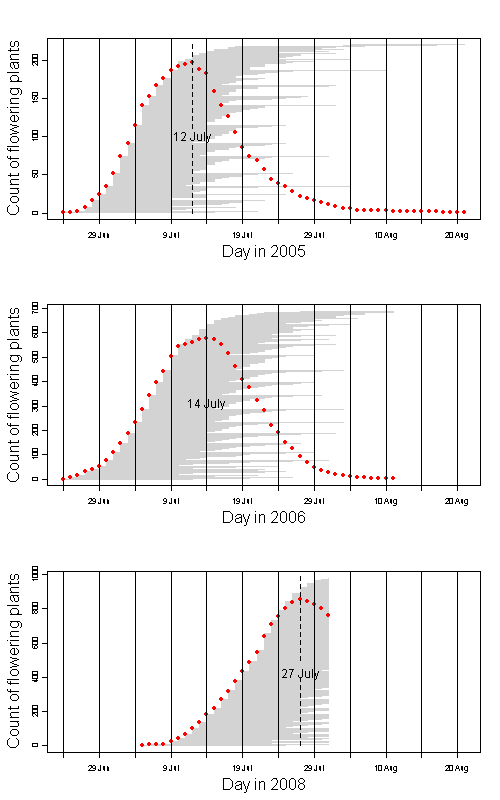
Echinacea angustifolia is flowering late this year.
Peak flowering this year was 27 July. Peak was 12 July and 14 July in 2005 and 2006 respectively. Here’s a rough graph that shows flowering phenology in these years. Red dots are the count of fl plants on each day. Horizontal gray lines indicate days that each plant shed pollen.

See the updated animation of flowering in the common garden experimental plot.
This animated GIF file is a map of all plants that flowered in the CG on each day from July 5 to July 30th. Each dot represents a plants that’s flowering on the day (see upper right corner).
 Click on the thumbnail to see a full-sized image. Click on the thumbnail to see a full-sized image.
 This legend shows plants with 3, 1, and 2 heads flowering (left to right). This legend shows plants with 3, 1, and 2 heads flowering (left to right).
Hi all,
Since this is my first flog entry of the season at quick intro for our new readers. My name is Jennifer and I am a Ph.D. graduate student at University of Illinois-Chicago in an integrated program called LEAP (landscapes ecological and anthropogenic processes) . I just finished up my third year and have been part of the Echinacea project for longer than I often like to admit. If you are an avid flog reader you may remember be from such classic 2007 entries like “Fishing in Minnesota�? and “Microsatellites in Echinacea…they do exist.�? Today I am going to discussing my plot at Hegg Lake. In the summer 2005 we followed the DAILY flowering phenology of the 224 flowering plants in the main Common Garden. We took the seeds from the flowering heads and germinated and planted around 4,000 (3,942 to be exact) and planted them in the spring of 2006 at a new common garden site at on DNR owned land near Hegg Lake (about 7.5 miles from the main Common Garden site). Hegg Lake is a beautiful site and it is, fortunately, on top of a small plateau so there is nearly always a breeze and the mosquitoes stay away.

Measuring at Hegg Lake 2008
We have just finished measuring and rechecking Hegg and I have final survival and growth info for this year. Unfortunately the last winter was really rough on my poor little plants and death was much higher than I would have liked. This also meant measuring and rechecking Hegg took a long time this year. Next year I must come up with a better method for measuring and rechecking. My current plan is to buy 50 meter tapes and measure along the 50 meter tape…I think this will dramatically reduce the time. Below is info for the last three years of survival and growth data. The first number the the year, then the average number of leaves, then the average height of tallest leaf (cm) and finally percent survival (cumulative).
2006- 2.13- 6.36- 94%
2007- 2.14- 13.24- 85%
2008- 2.07- 13.61- 76%
As you can see my plants barely grew (and that is only the ones that survived) and the average number of leaves actually went down. More disappointing is the survival which took at hit with the really long cold winter. That is it for Hegg this year…glad it is done…hopefully next year, with a site burn, my plants will grow more and death won’t be as bad.
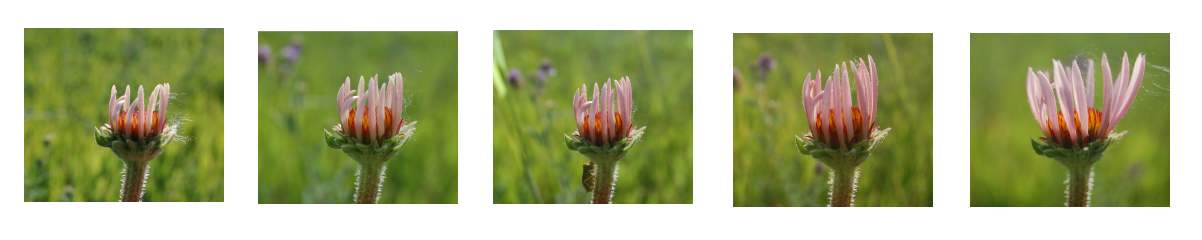
Here’s a practice time lapse series for plant (28, 943) from July 2nd-6th. I’ll be photographing 16 plants every morning or until people get tired of driving me around to the garden. I didn’t hit the ‘thumbnail’ option when I uploaded this, so if you want to see it in its full glory, right-click and go to “view image”.

Even though I’ve marked the position and height of the tripod with flags, it looks like it’s difficult to get the same photo every time. The changing background, I suspect, is a result of the head growing upwards a bit, causing me to change the camera angle. This shouldn’t be as much of an issue in the pictures taken from above.
Bonus!
Here’s a link to an exciting photo I took when we were out boating on the 4th.
http://flickr.com/photos/putsaltinyoureyes/2643272737/
Hello all,
So this is my very first blog entry so it will be lacking all the neat links to pictures et al in that are in other people’s entries but it will talk about Echinacea.
Since this is my first blog I should probably spend a little time introducing myself. My name is Jennifer I am a in an inter-disciplinary PhD program, called LEAP, at the University of Illinois at Chicago in conjunction with the Chicago Botanic Garden. LEAP stands for Landscape Ecological and Anthropogenic Processes, it is an NSF funded IGERT program aimed at increasing biodiversity in human altered landscapes. For a much better description of LEAP see http://www.uic.edu/depts/bios/leap/. As for the Echinacea Project I have been involved with the project first as an intern back in 2003-2004 then as a graduate student (since summer 2005). My research mainly focuses on understanding how flowering phenology (when a plant flowers) shapes seed set, pollen movement, and ultimately genetic structure in a population. For more see my website at http://www2.uic.edu/~ison/.
To understand how flowering phenology shapes population structure we use a variety of methods. First we collect phenology data in the common garden. The current protocol has us counting anthers shedding pollen every other day. We then collect the seed heads in the fall and individually weigh a subset of the seeds to get an estimate of seed set. Why individually weigh seeds? Well it is the only non-destructive method of determining if an achene (the technical term for fruits in the Asteraceae) actually has a viable embryo. We know that 97% or seeds weighing greater than 2 mg will germinate and 91% of less weighing less than 2 mg will not germinate. As of this spring we have individually weighed (with the help of an amazing volunteer named Art) weighed 30,211 seeds. This June Art has embarked on weighing another 3,000 seeds from the 2006 flowering plants. So far we know that late flowering plants set much less seed than early or peak flowering plants. To get at the hereditability of flowering phenology we planted a second common garden (yes there is another common garden) on a site called Hegg Lake owned by the DNR. The site was planted with just about 4,000 seedlings in May 2006 and the plants will hopefully flower before I finish my PhD.
Finally, to understand how flowering phenology influences pollen movement we are using molecular genetic techniques, specifically microsatellites markers. Microsatellites are a molecular genetic marker that consist of repeating non-coding regions in the genome (eg GATGATGATGAT). Since they are repeating non-coding regions they mutate relatively rapidly so there are different number of repeats for the same microsatellite in a population–alleles. With these microsatellites we will be able to, eventually, take a seed from a known maternal plant and find out who the dad is. I developed microsatellites specifically for Echinacea last fall at the Field Museum of Natural History in Chicago. I now need to determine of these microsatellites I found do they actually have enough alleles to conduct paternity analysis. While everyone else has been up in Minnesota flying kites I have been spending time in the genetics lab trying to get the microsatellites to work. After spending too long figuring out the optimal number of cycles and temperature in the PCR, plus how much, if any, Mg to add I finally have been having success with about 5 microsatellites.
Today I ran four out of the five primers on 16 plants (8 from the preserve and 8 from Steven’s approach) and had multiple alleles!!! I had between 4 to 6 alleles just in these 16 plants. It was very exciting after spending so long playing with PCR conditions. It was very rewarding to run samples that actually worked and even better that all the microsatellites were at least moderately variable. My goal is to get 8 primers with all with around 6 alleles, which should be enough to do figure out who the dad is. For my next blog entry I’ll see if I can figure out how to add pictures and I’ll insert some images of my microsatellite alleles.
I think that is more than enough for my first entry. I will hopefully have more exciting news regarding the microsatellites before I come up to Minnesota (which is on July 15th).
Night!
Jennifer
Notes to self:
Equipment for MN
-2 meter sticks
-camera
-data logger (?)–talk to JF
Finish up at CBG
-put seeds into freezer–talk to AS?
-data entry for Theresa
-get tissue samples into fresh silica gel
-molecular work for John and Eric
|
|