Amy Waananen’s just had a paper published in New Phytologist. She reports how the difference in flowering time of a plant’s two parents influences the plant’s fitness. Many researchers have investigated how differences in the location of parents (close or far) influences progeny fitness. Few, if any, have investigated how differences in flowering time affects progeny fitness.
Differences in flowering time are not as straightforward as differences in location. In space, parents can be far or close and we use distance to measure it. To state the obvious, negative distances do not makes sense. In time, parents can be far (asynchronous) or near (synchronous). But maternal plants can be earlier or later than paternal plants. This aspect of distance in time is fundamentally different than distance in space. Amy used positive and negative values to indicate which parent flowered earlier. Remarkably, this perspective really mattered to the fitness of progeny. Wow!
Amy’s discovery is really cool, it’s a surprise, and it’s a useful contribution to basic science. Amy also suggested some non-intuitive management strategies that can help promote plant fitness and resilience of populations in the face of changing environments.
Here’s the citation:
Waananen, A., Ison, J.L., Wagenius, S. and Shaw, R.G. 2025. The fitness effects of outcrossing distance depend on parental flowering phenology in fragmented populations of a tallgrass prairie forb. New Phytologist. https://doi.org/10.1111/nph.70240
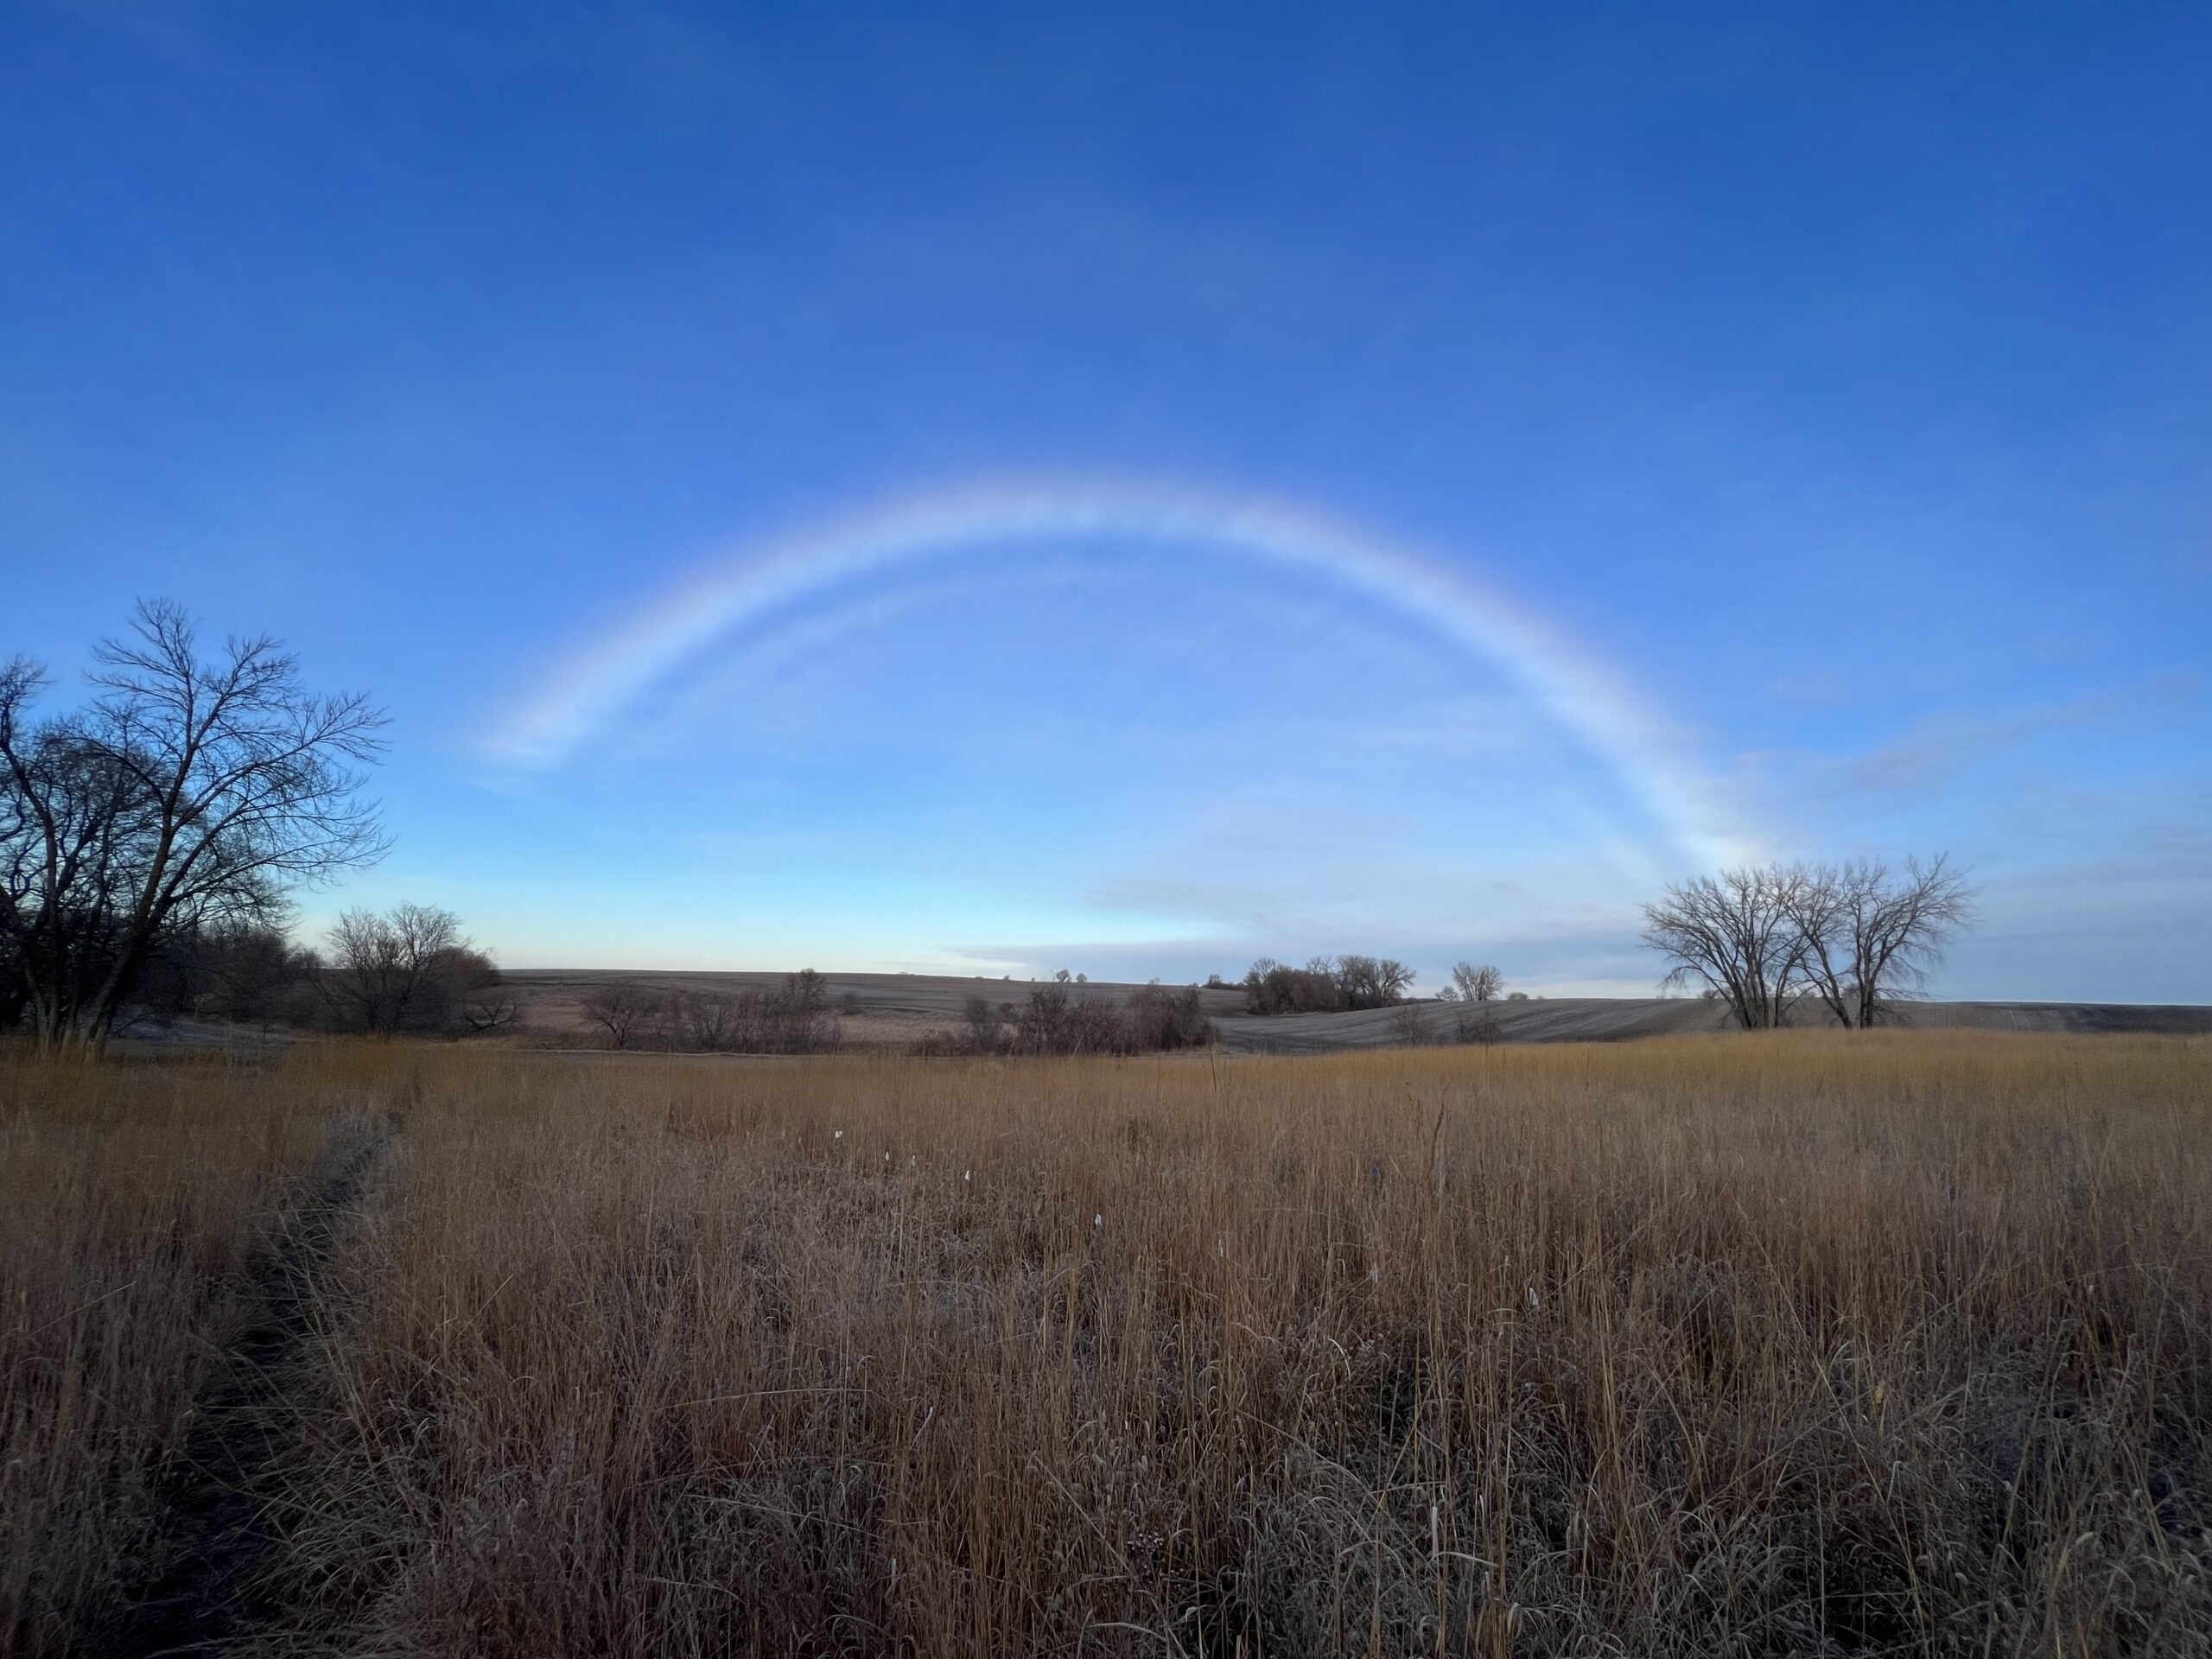
A rainbow-like cloud glows over exPt01 while the team was in MN for fall 2023 burns. A good omen for the field season that followed!
Introduction
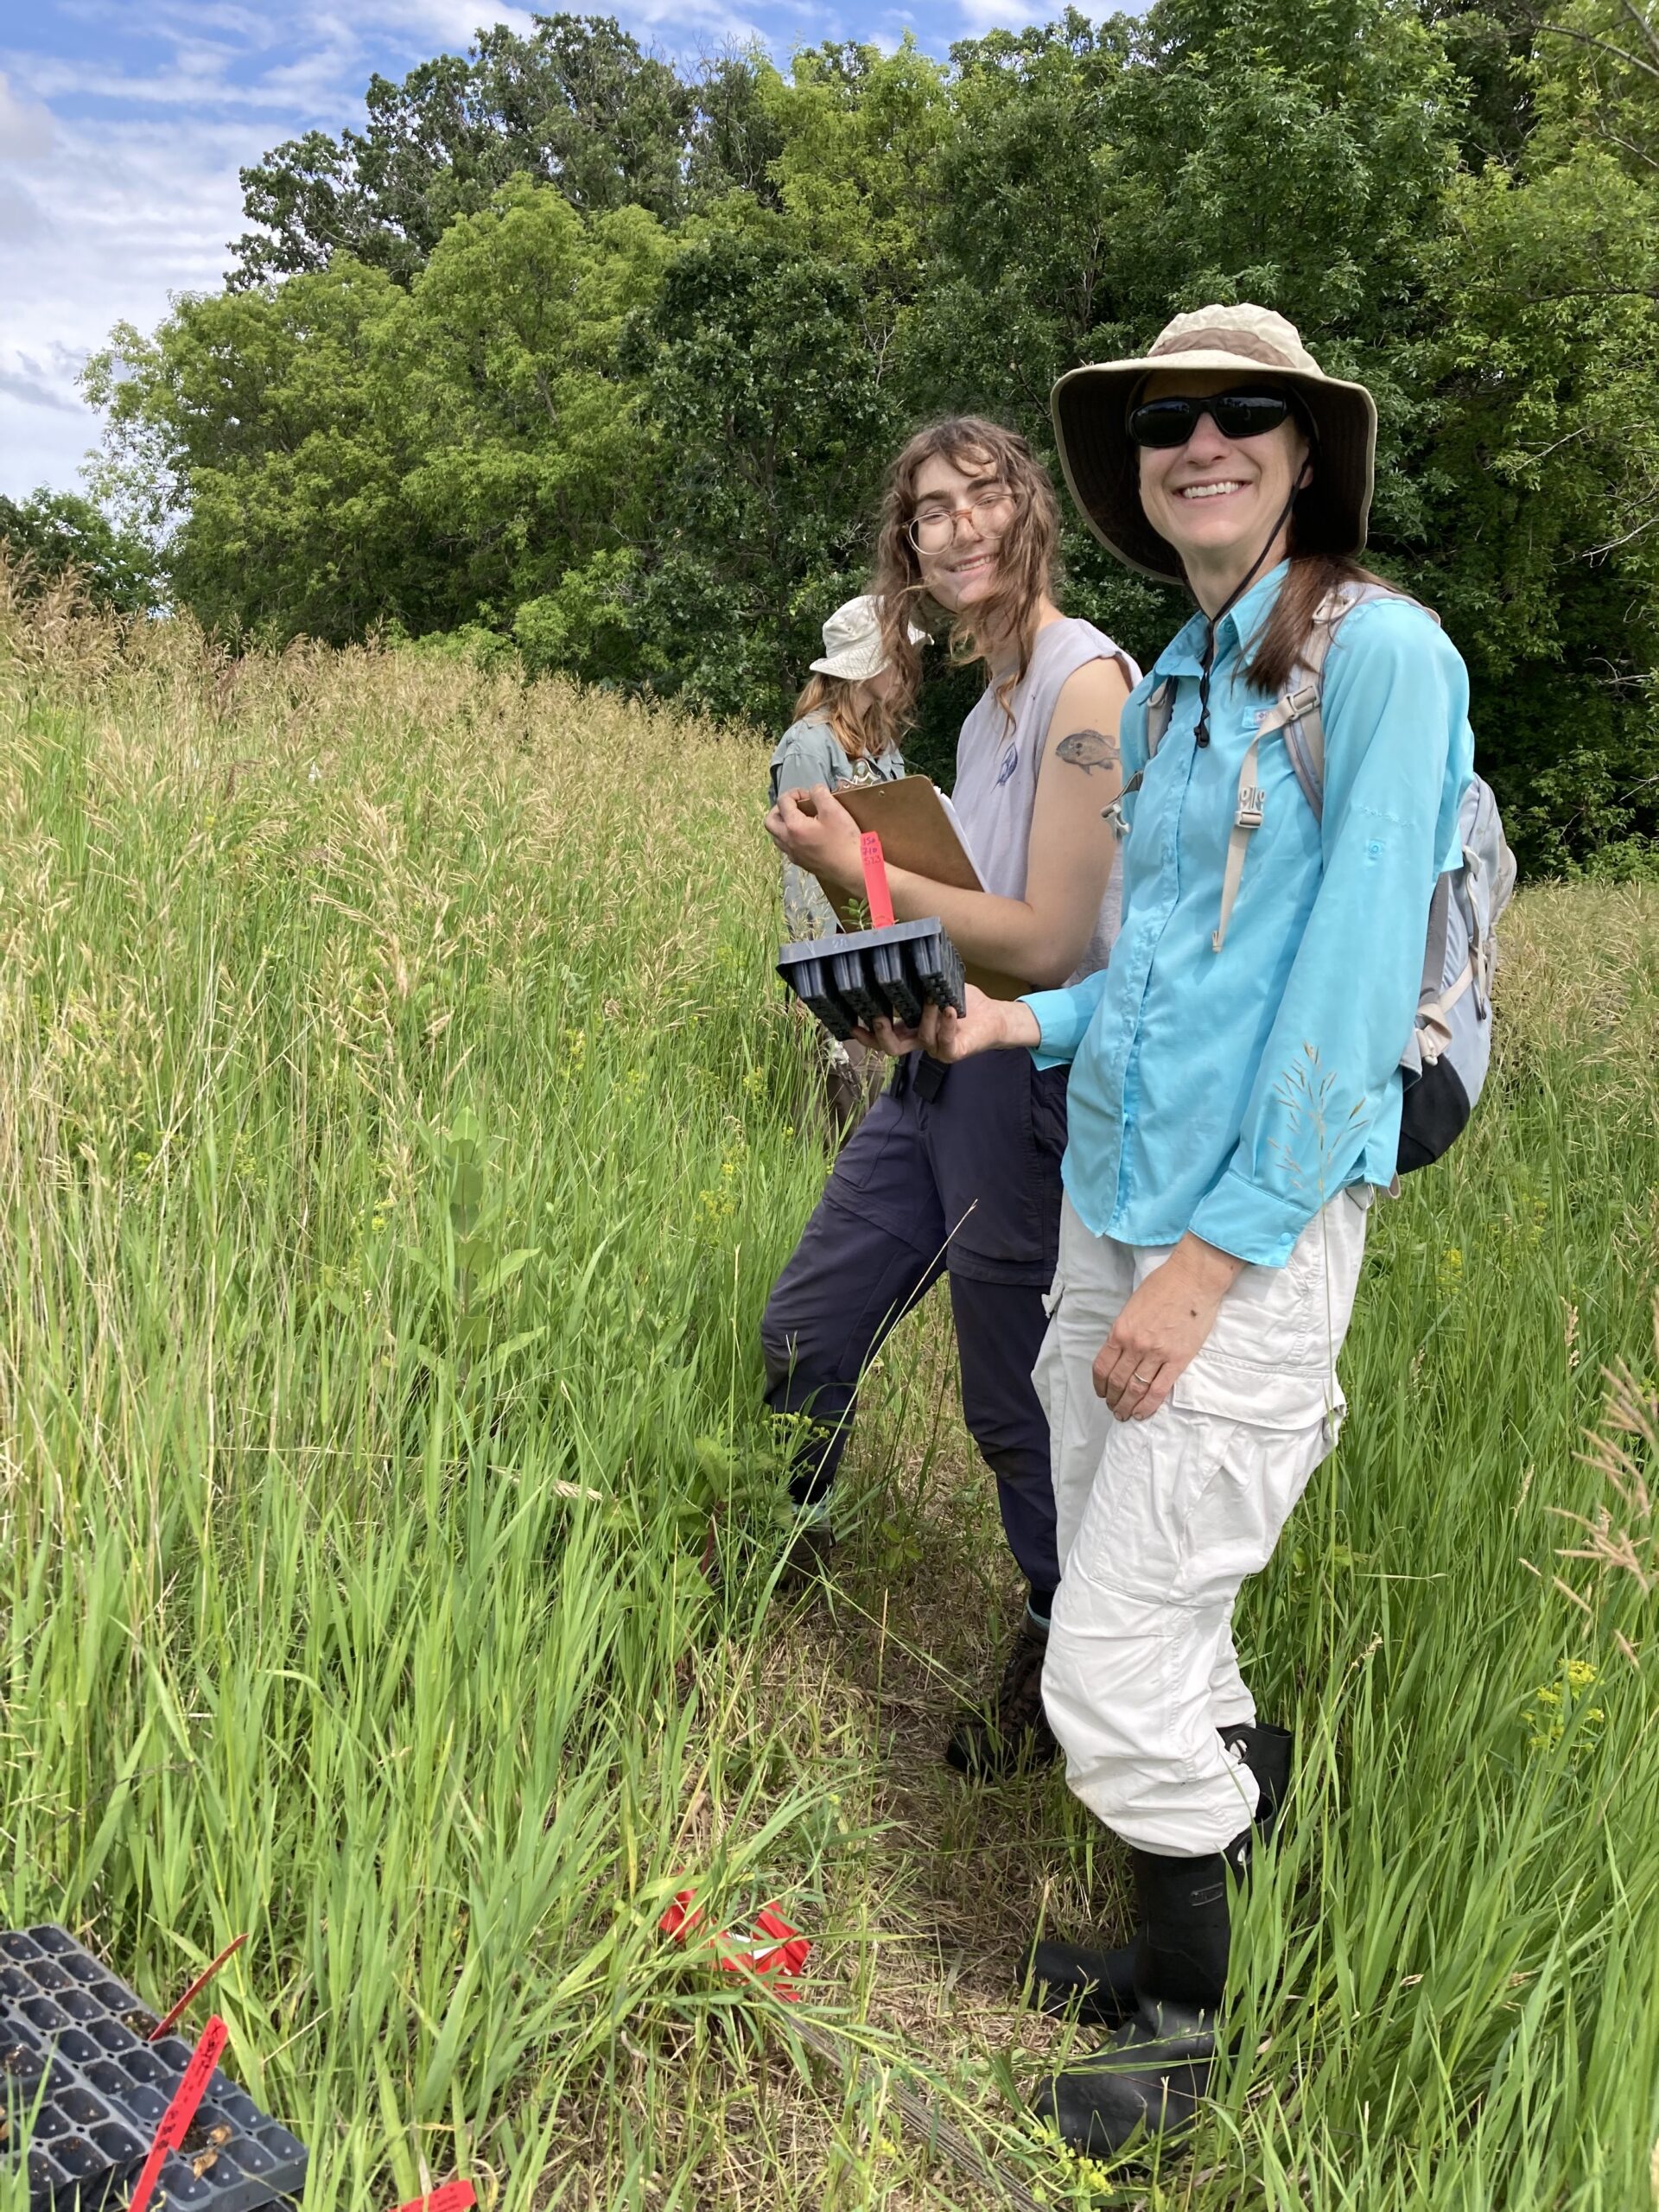
Every year since 1996, members of Team Echinacea have recorded flowering phenology, taking measure data and harvested heads from thousands of Echinacea angustifolia plants in plots with “common garden” experimental designs. These experimental plots are located in prairie remnants, restorations, and abandoned agricultural fields that are managed as grassland habitat. Currently, the Echinacea Project has 10 established experimental plots. Some plots have multiple ongoing experiments within.
In the past few years, we have scaled back significantly on taking phenology records in the experimental plots. During 2023 and 2024, our primary goals with phenology were to a) map out the positions of flowering plants/heads within the plots, b) deploy twist ties to all flowering heads to ease measuring and harvesting, and c) to record the day of first flowering for all heads in plots to continue the long-term data collection in a more scaled-back fashion. As a result, we conducted only a few rounds of phenology per plot and did not capture the full range of flowering dates for every head. Phenology info is briefly reported on in each plot’s update along with the location of the data. This applies to the hybrid experimental plots as well.
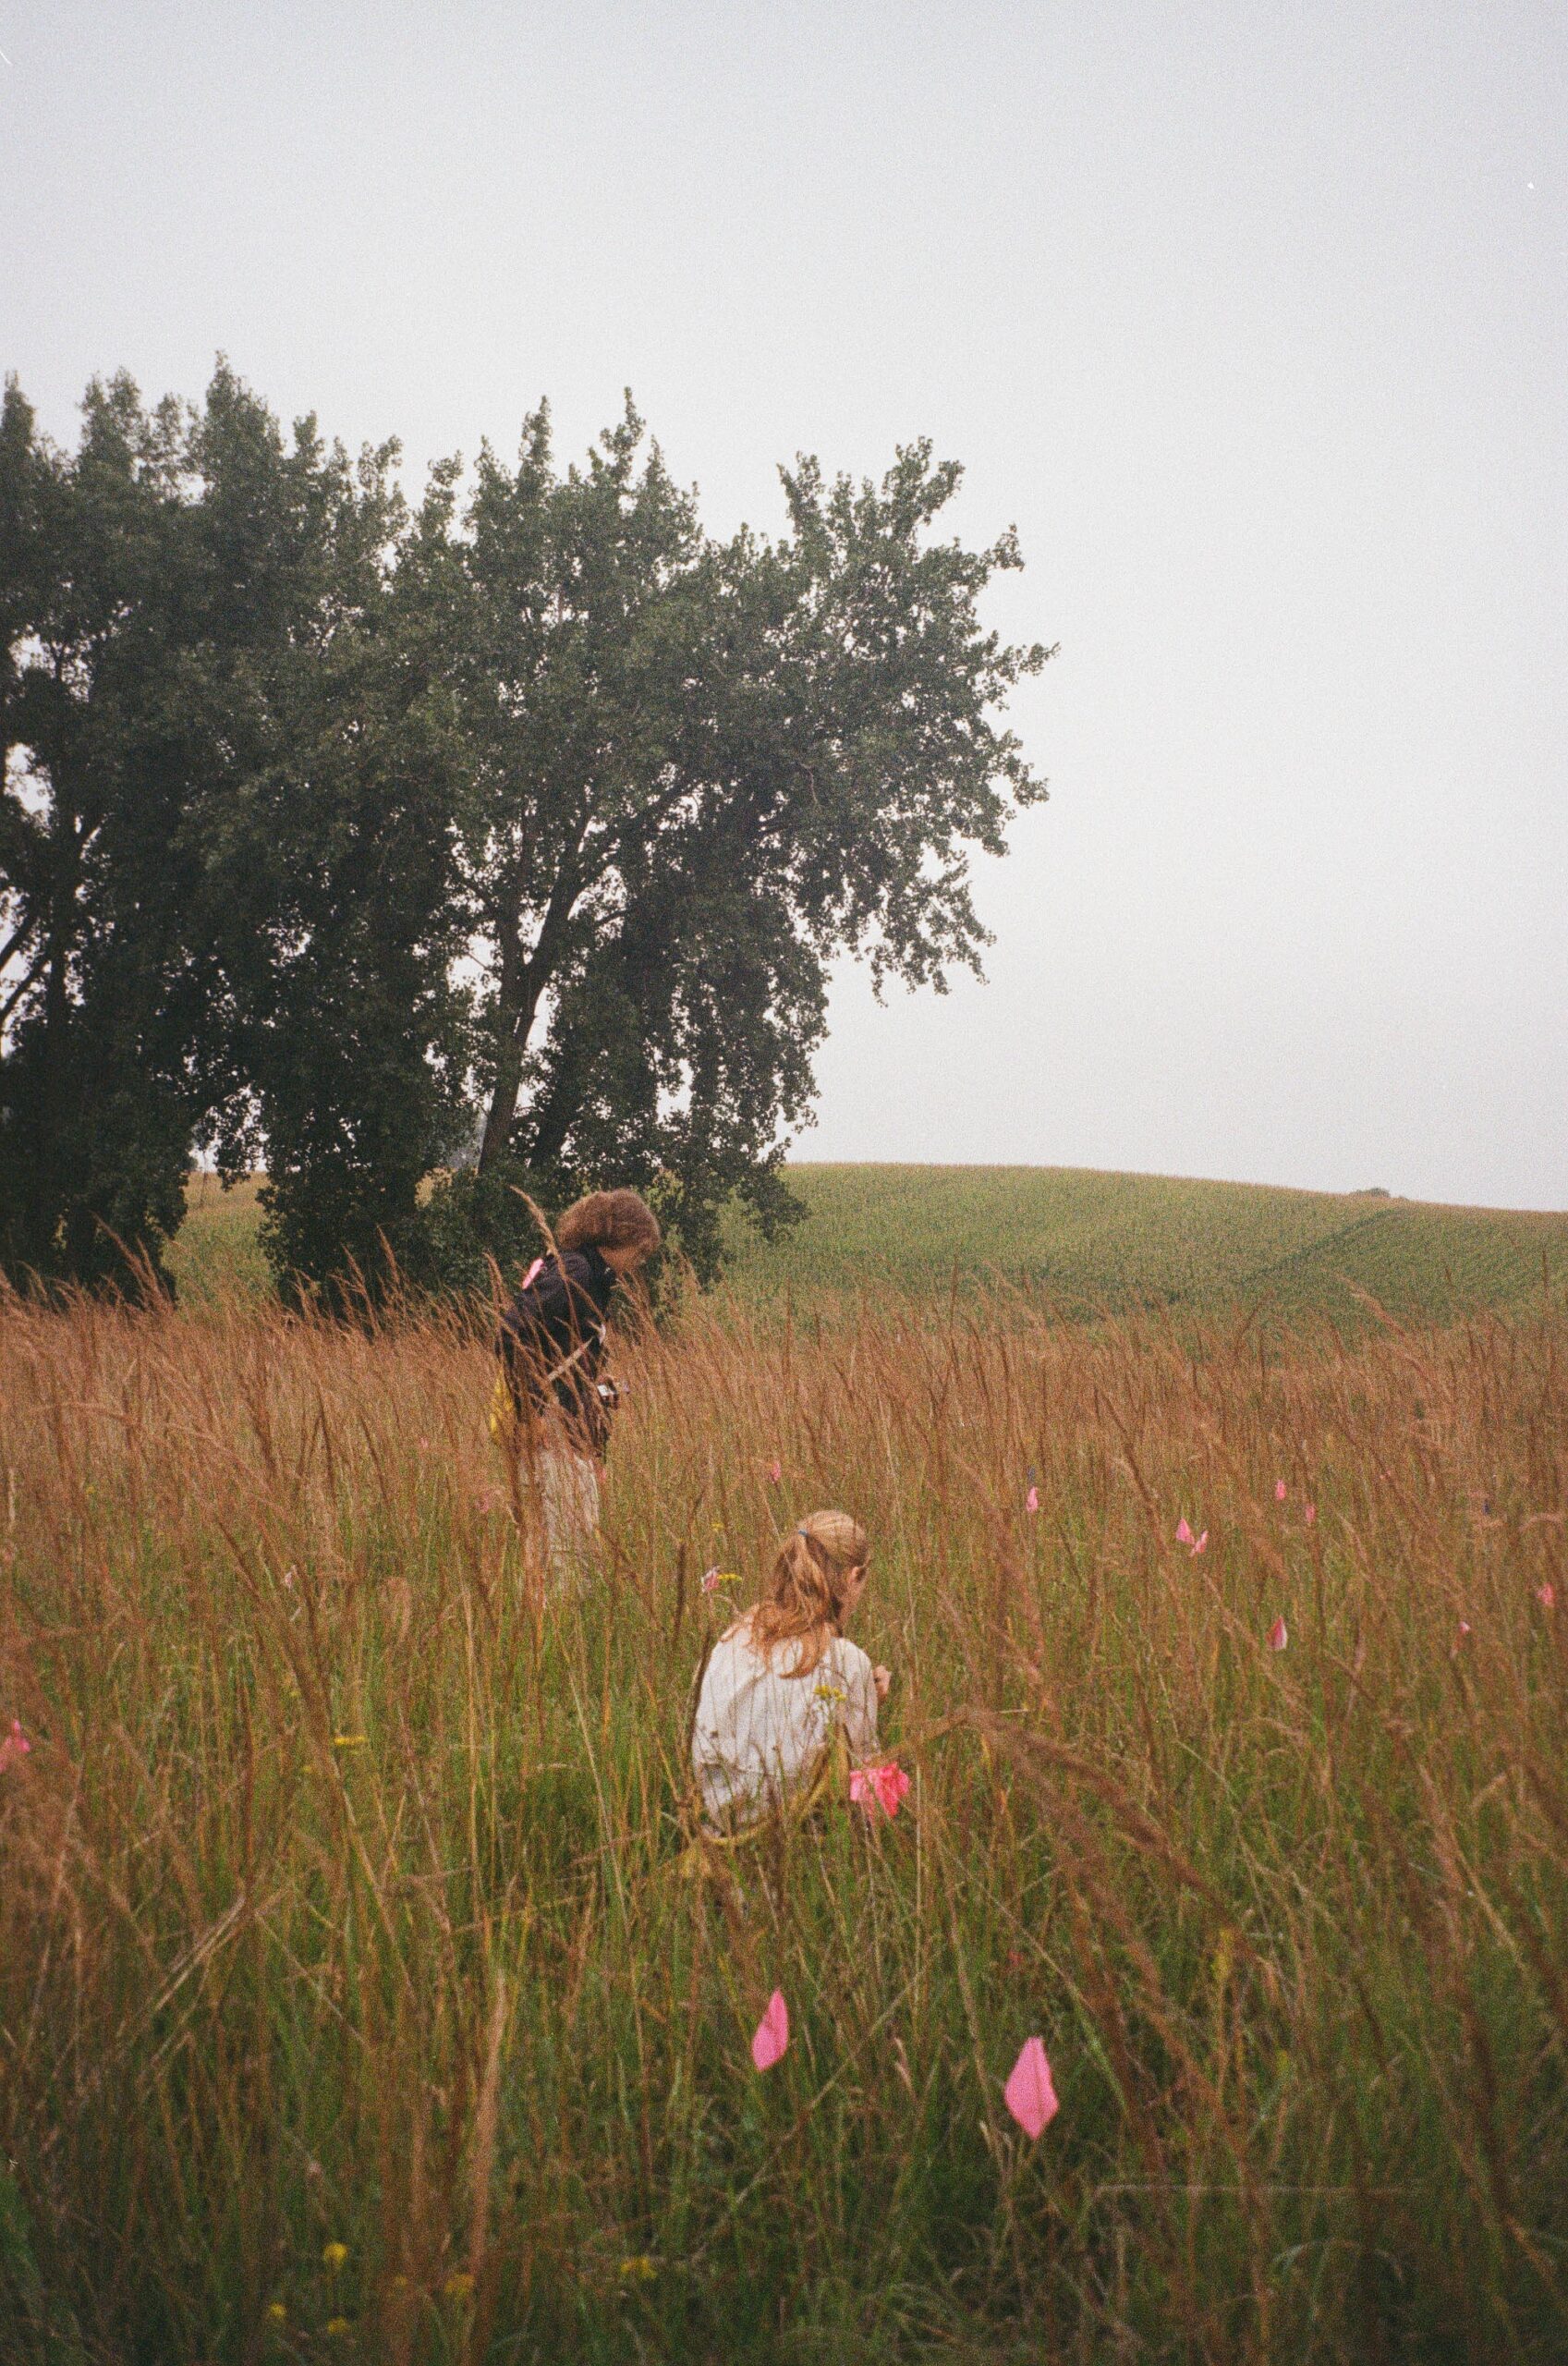
Crew members Wyatt and Emma search can’t find positions in exPt01
Experimental plot 1 was first planted in 1996 (cleverly termed the 1996 cohort), and has been planted with nine other experiments in subsequent years, with the most recent planting being Amy Waananen’s inter-remnant crosses. It is the largest of the experimental plots, with over 10,000 planted positions; experiments in the plot include testing fitness differences between remnants (1996, 1997, 1999), quantifying effects of inbreeding (inb1, inb2), and assessing quantitative genetic variation (qGen1). It also houses a number of smaller experiments, including fitness of Hesperostipa spartea, aphid addition and exclusion, and pollen addition and exclusion (these experiments have separate posts).
In 2024, we conducted phenology in this plot between July 8th and July 18th. During measure, we visited 3123 of the 10,992 positions planted and found 2728 living plants. 83 plants were classified as “flowering” in exPt01 this year, totally 96 heads. This is a significantly fewer plants than flowered in summer 2023 (560). In summer 2024, we harvested 82 total Echinacea heads in exPt01 (including many from the ever-productive 99 south garden).
ExPt01 is also the only plot to have staples marking positions where plants that have died used to be. We added 67 staples to the experimental plot this year, but only in locations that we couldn’t find staples during measure that were already supposed to be there. We didn’t have time to get to every position with a missing staple (see where we covered here: Dropbox/CGData/125_measure/measure2024/staple2024/2024addStaplesExPt01.pdf). We did not have time to re-search locations that we called plants “can’t finds” at three years in a row in 2023 and 2024. Once these locations receive their final search, hopefully in 2025, we can put staples at them as well.
This experiment was started in 2020 by Amy Waananen to understand how the distance between plants in space and in their timing of flowering influences the fitness of their offspring. If plants that are located close together or flower at the same time are closely related, their offspring might be more closely related and inbred, and have lower fitness than plants that are far apart and/or flower more asynchronously. Plants in this experiment resulted from interremnant hand-crossings from 9 remnants: On27, SGC, GC, NGC, EELR, KJ, NNWLF, NWLF, LF. Crossing took place in 2020 and 2021, and individuals were planted in 2020 (as seed) and 2022 (as plugs). Surviving plants were assigned cgPlaIds in 2023 and incorporated into the p1 workflow. Mortality in this experiment has been high, with 80.3% of positions searched in 2024 resulting in “can’t finds.”. We did not re-search “can’t find” positions in 2024 due to time constraints (with Amy’s approval).
The inb1 experiment investigates the relationship between inbreeding level and fitness in Echinacea angustifolia. Each plant in experiment inb1 originates from one of three cross types, depending on the relatedness of the parents: between maternal half siblings; between plants from the same remnant, but not sharing a maternal or paternal parent; and between individuals from different remnants. All individuals were planted in 2001. We continued to measure fitness and flowering phenology in these plants.
The inb2 experiment investigates the relationship between inbreeding level and fitness in Echinacea angustifolia. Each plant in experiment inb2 originates from one of three cross types, depending on the relatedness of the parents: between maternal half siblings; between plants from the same remnant, but not sharing a maternal or paternal parent; and between individuals from different remnants. All individuals were planted in 2006. We continued to measure fitness and flowering phenology in these plants. In October 2024, former team member Riley Thoen recently published a paper in the Journal of Hereditary on the conservation value of small remnants using results from this experiment.
The qGen1 (quantitative genetics, or just qGen) experiment in p1 was designed to quantify the heritability of traits in Echinacea angustifolia. We are especially interested in Darwinian fitness. Could fitness be heritable? During the summer of 2002 we crossed plants from the 1996 & 1997 cohorts of exPt01. We harvested heads, dissected achenes, and germinated seeds over the winter. In the spring of 2003 we planted the resulting 4468 seedlings (this great number gave rise to this experiment’s nickname “big batch”).
data in cgData repo: ~/cgData/summer2024/exPt01Phenology
Measure data (status, size, etc.)
data in SQL database
Harvest data (IDs of harvested heads, missing achenes, etc)
detailed data in dropbox: dropbox/CGData/140_reconcile/reconcile2024/reconcileOut/2024harvestListReconciledExport.csv
data in SQL database
data in echinaceaLab package (hh.2024)
Samples collected:
82 heads harvested
At cbg for processing (counted, ready to randomize)
Products:
Publications
Thoen, R. D., A. Southgate, G. Kiefer, R.G. Shaw, S. Wagenius, The conservation value of small population remnants: Variability in inbreeding depression and heterosis of a perennial herb, the narrow-leaved purple coneflower (Echinacea angustifolia). 2024. Journal of Heredity esae055. https://doi.org/10.1093/jhered/esae055.
Page, M. L., Ison, J. L., Bewley, A. L., Holsinger, K. M., Kaul, A. D., Koch, K. E., Kolis, K. M., and Wagenius, S. 2019. Pollinator effectiveness in a composite: A specialist bee pollinates more florets but does not move pollen farther than other visitors. American Journal of Botany 106: 1487–1498. PDF
Waananen, A., G. Kiefer, J. L. Ison, and S. Wagenius. 2018. Mating opportunity increases with synchrony of flowering among years more than synchrony within years in a nonmasting perennial. The American Naturalist 192: 379-388. PDF | Appendix | online version
Muller, K. and S. Wagenius. 2016. Echinacea angustifolia and its specialist ant-tended aphid: a multi-year study of manipulated and naturally-occurring aphid infestation. Ecological Entomology 41: 51-60. PDF | online version
Shaw, R. G., S. Wagenius and C. J. Geyer. 2015. The susceptibility of Echinacea angustifolia to a specialist aphid: eco-evolutionary perspective on genotypic variation and demographic consequences. Journal of Ecology 103: 809-818. PDF
Kittelson, P., S. Wagenius, R. Nielsen, S. Qazi, M. Howe, G. Kiefer, and R. G. Shaw. 2015. Leaf functional traits, herbivory, and genetic diversity in Echinacea: Implications for fragmented populations. Ecology 96: 1877–1886. PDF
Ison, J.L., and S. Wagenius. 2014. Both flowering time and spatial isolation affect reproduction in Echinacea angustifolia. Journal of Ecology 102: 920–929. PDF | Supplemental Material | Archived Data
Ison, J.L., S. Wagenius, D. Reitz., M.V. Ashley. 2014. Mating between Echinacea angustifolia (Asteraceae) individuals increases with their flowering synchrony and spatial proximity. American Journal of Botany 101: 180-189. PDF
Ridley CE, Hangelbroek HH, Wagenius S, Stanton-Geddes J, Shaw RG, 2011. The effect of plant inbreeding and stoichiometry on interactions with herbivores in nature: Echinacea angustifolia and its specialist aphid. PLoS ONE 6(9): e24762. http://dx.plos.org/10.1371/journal.pone.0024762
Wagenius, S., H. H. Hangelbroek, C. E. Ridley, and R. G. Shaw. 2010. Biparental inbreeding and interremnant mating in a perennial prairie plant: fitness consequences for progeny in their first eight years. Evolution 64: 761-771. Abstract | PDF
Ruth G. Shaw, Charles J. Geyer, Stuart Wagenius, Helen H. Hangelbroek, and Julie R. Etterson. 2008. Unifying life-history analyses for inference of fitness and population growth. American Naturalist 172: E35 – E47. Abstract | PDF | Supplemental Material
Geyer, C.J., S. Wagenius, and R.G. Shaw. 2007. Aster models for life history analysis. Biometrika 94: 415-426. PDF | Supplemental Material
Grad student work
Drake Mullett’s PhD dissertation (2025)
Wyatt Mosiman’s MS thesis (2024)
Amy Waananen’s paper “The fitness effects of outcrossing distance depend on parental flowering phenology in fragmented populations of a tallgrass prairie forb” (with co-authors Ison, Wagenius, and Shaw) was just accepted by New Phytologist–it includes data from parents in exPt01 and progeny in exPt02.
AKA the heritability of flowering time experiment, exPt02 was designed to examine the role flowering phenology plays in the reproduction of Echinacea angustifolia. Jennifer Ison planted this plot in 2006 with 3,961 individuals selected for extreme (early or late) flowering timing, known as phenology. Using this phenological data, we explore how flowering phenology influences reproductive fitness and estimate the heritability of flowering time in E. angustifolia. In the summer of 2024, we conducted phenology between July 10th and July 19th. During measure, we visited 1,725 positions of the 3,961 positions originally planted. We measured 1,190 living plants, of which 302 were flowering with a total of 402 flowering heads (count excludes vertical developments). In the fall, we harvested 375 heads from exPt02. We observed much lower levels of seed predation by ground squirrels this year than the past few years.
data in cgData repo: ~/cgData/summer2024/exPt02Phenology
Measure data (status, size, etc.)
data in SQL database
Harvest data (IDs of harvested heads, missing achenes, etc)
detailed data in dropbox: dropbox/CGData/140_reconcile/reconcile2024/reconcileOut/2024harvestListReconciledExport.csv
data in SQL database
data in echinaceaLab package (hh.2024)
Samples collected:
375 heads harvested
at CBG for processing
Products:
Papers
Pearson, A.E., Z. Zelman, L.A. Hill, M.A. Stevens, E.X. Jackson, M.M.N. Incarnato, R.M. Johnson, S. Wagenius, and J.L. Ison. 2023. Pollinators differ in their contribution to the male fitness of a self-incompatible composite. American Journal of Botany 110(6): e16190. https://doi.org/10.1002/ajb2.16190
Reed, W. J., J. L. Ison, A. Waananen, F. H. Shaw, S. Wagenius, R. G. Shaw. 2022. Genetic variation in reproductive timing in a long-lived herbaceous perennial. American Journal of Botany 109(11) 1861–1874: https://doi.org/10.1002/ajb2.16072
Page, M. L., Ison, J. L., Bewley, A. L., Holsinger, K. M., Kaul, A. D., Koch, K. E., Kolis, K. M., and Wagenius, S. 2019. Pollinator effectiveness in a composite: A specialist bee pollinates more florets but does not move pollen farther than other visitors. American Journal of Botany 106: 1487–1498. PDF
Grad student work
Wyatt Mosiman’s MS thesis (2024)
Amy Waananen’s paper “The fitness effects of outcrossing distance depend on parental flowering phenology in fragmented populations of a tallgrass prairie forb” (with co-authors Ison, Wagenius, and Shaw) was just accepted by New Phytologist–it includes data from parents in exPt01 and progeny in exPt02.
We may have missed some other products.
exPt05:
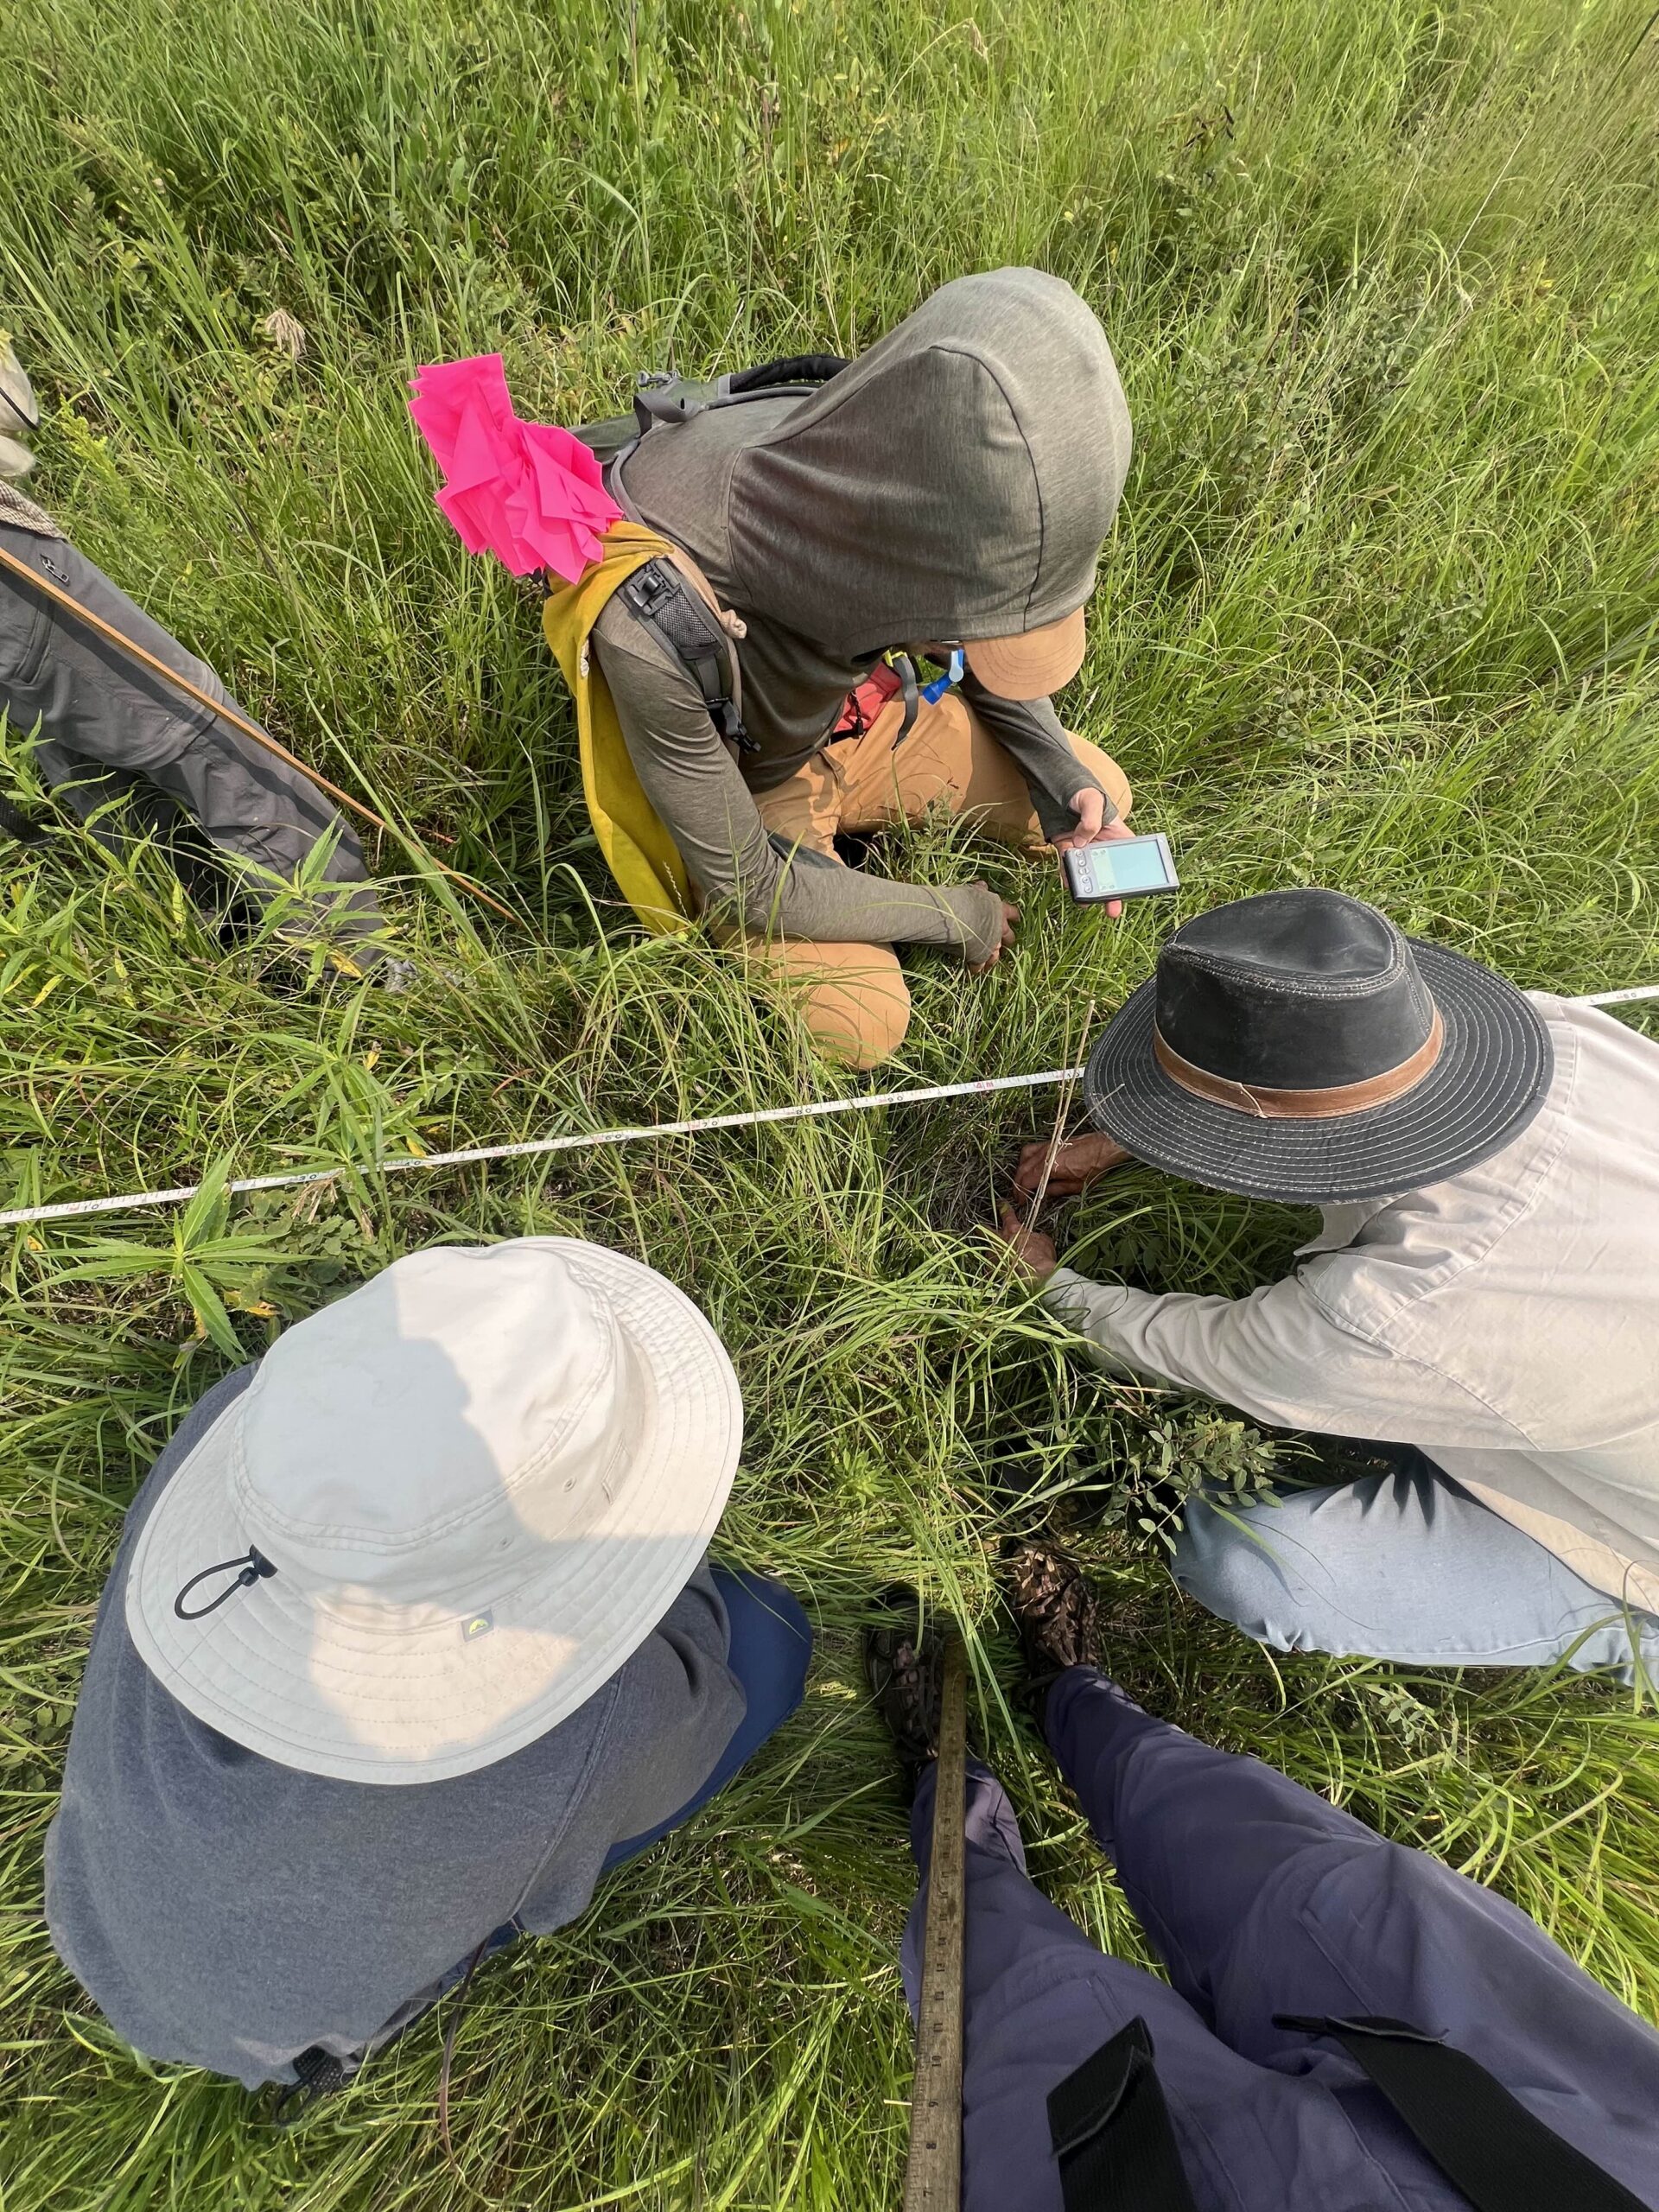
The only experimental plot at Staffanson Prairie Preserve (SPP), exPt05 was planted to compare progeny of maternal plants from burned and unburned sections of SPP. There were originally 2800 individuals planted, but high mortality made it impractical to visit the plot row-by-row. Now, we treat the plot like demography. We use our survey-grade GPS to find plants in exPt05 that have previously flowered and add more plants to the stake file if new plants in the plot flower. In 2024, we found 17 living plants in exPt05 during flowering/total demo, 8 of which were flowering! We also observed (but did not take data on) additional basal plants within the plot boundaries that appeared to be growing on a 1×1 meter grid. ExPt05 persists!
Team Echinacea established quantitative genetics experiments to quantify additive genetic variance of fitness in Echinacea, with the idea that we can estimate evolutionary potential of study populations. The plants in qGen2 and qGen3 are plants in the 1996, 1997, and 1999 cohorts. These plants were crossed with pollen from plants in remnants to produce seed for qGen2 and qGen3, which now inhabit exPt08. Originally, 12,813 seeds were sown in the common garden. Seeds from the same cross (shared maternal and paternal plants) were sown in meter-long segments between nails. In the summer of 2024, we conducted phenology between July 10th and July 19th. A total of 3,253 seedlings were originally found, but due to gradual mortality we only searched 448 positions in 2024 for plants, and we found evidence of 314 living individuals. We identified 24 flowering plants in with a total of 29 heads, of which we harvested 23.
data in cgData repo: ~/cgData/summer2024/exPt08Phenology
Measure data (status, size, etc.)
data in SQL database
Harvest data (IDs of harvested heads, missing achenes, etc)
detailed data in dropbox: dropbox/CGData/140_reconcile/reconcile2024/reconcileOut/2024harvestListReconciledExport.csv
data in SQL database
data in echinaceaLab package (hh.2024)
Samples collected:
23 heads harvested
at CBG for processing
Products:
None… yet!
tplot
tplot is located within the bounds of exPt08. Plants of many species here were rescued from the landfill site. They we transferred as chunks of prairie sod, and individual transplants. This year during flowering and total demo, we encountered 14 living Echinacea plants from which we harvest 12 heads.
Demography data: head counts, rosette counts, etc.
demap input files have been updated with 2024
Spatial location for all flowering and some basal (total demo) plants
demap input files have been updated with 2024
Harvest data (IDs of harvested heads, missing achenes, etc)
detailed data in dropbox: dropbox/CGData/140_reconcile/reconcile2024/reconcileOut/2024harvestListReconciledExport.csv
data in echinaceaLab package (hh.2024)
Samples collected:
12 heads harvested
at CBG for processing
Products:
None… yet!
Experimental plot management:
Just like other areas of the prairie, our experimental plots need management! Here’s a list of the stewardship activities that we conducted in or for our plots during 2024:
NU MS student Maddie Sadler shows off our sweet clover haul
None of our experimental plots burned in the fall or spring prior to the 2024 growing season
Collected seed to plant in p1, p2, & p8, including:
1) Elise collected Carex brevior, Carex bicknellii, and Carex gravida from several sites and from plants that we established a few years ago near exPt01
2) Liam established Viola pedatifida production tub,
3) We collected a few additional species (including Galium boreale, Solidago missouriensis, Astragalus adsurgens, Dichanthelium leibergii, and Bromus kalmii) we plan to establish via plug in spring 2025
Psst – next year person writing this report; I ran my numbers using the script Dropbox/echProjAdmin/projectStatusReports/psr2024/wmGatherDataForReports2024.R. Maybe this can help you out.
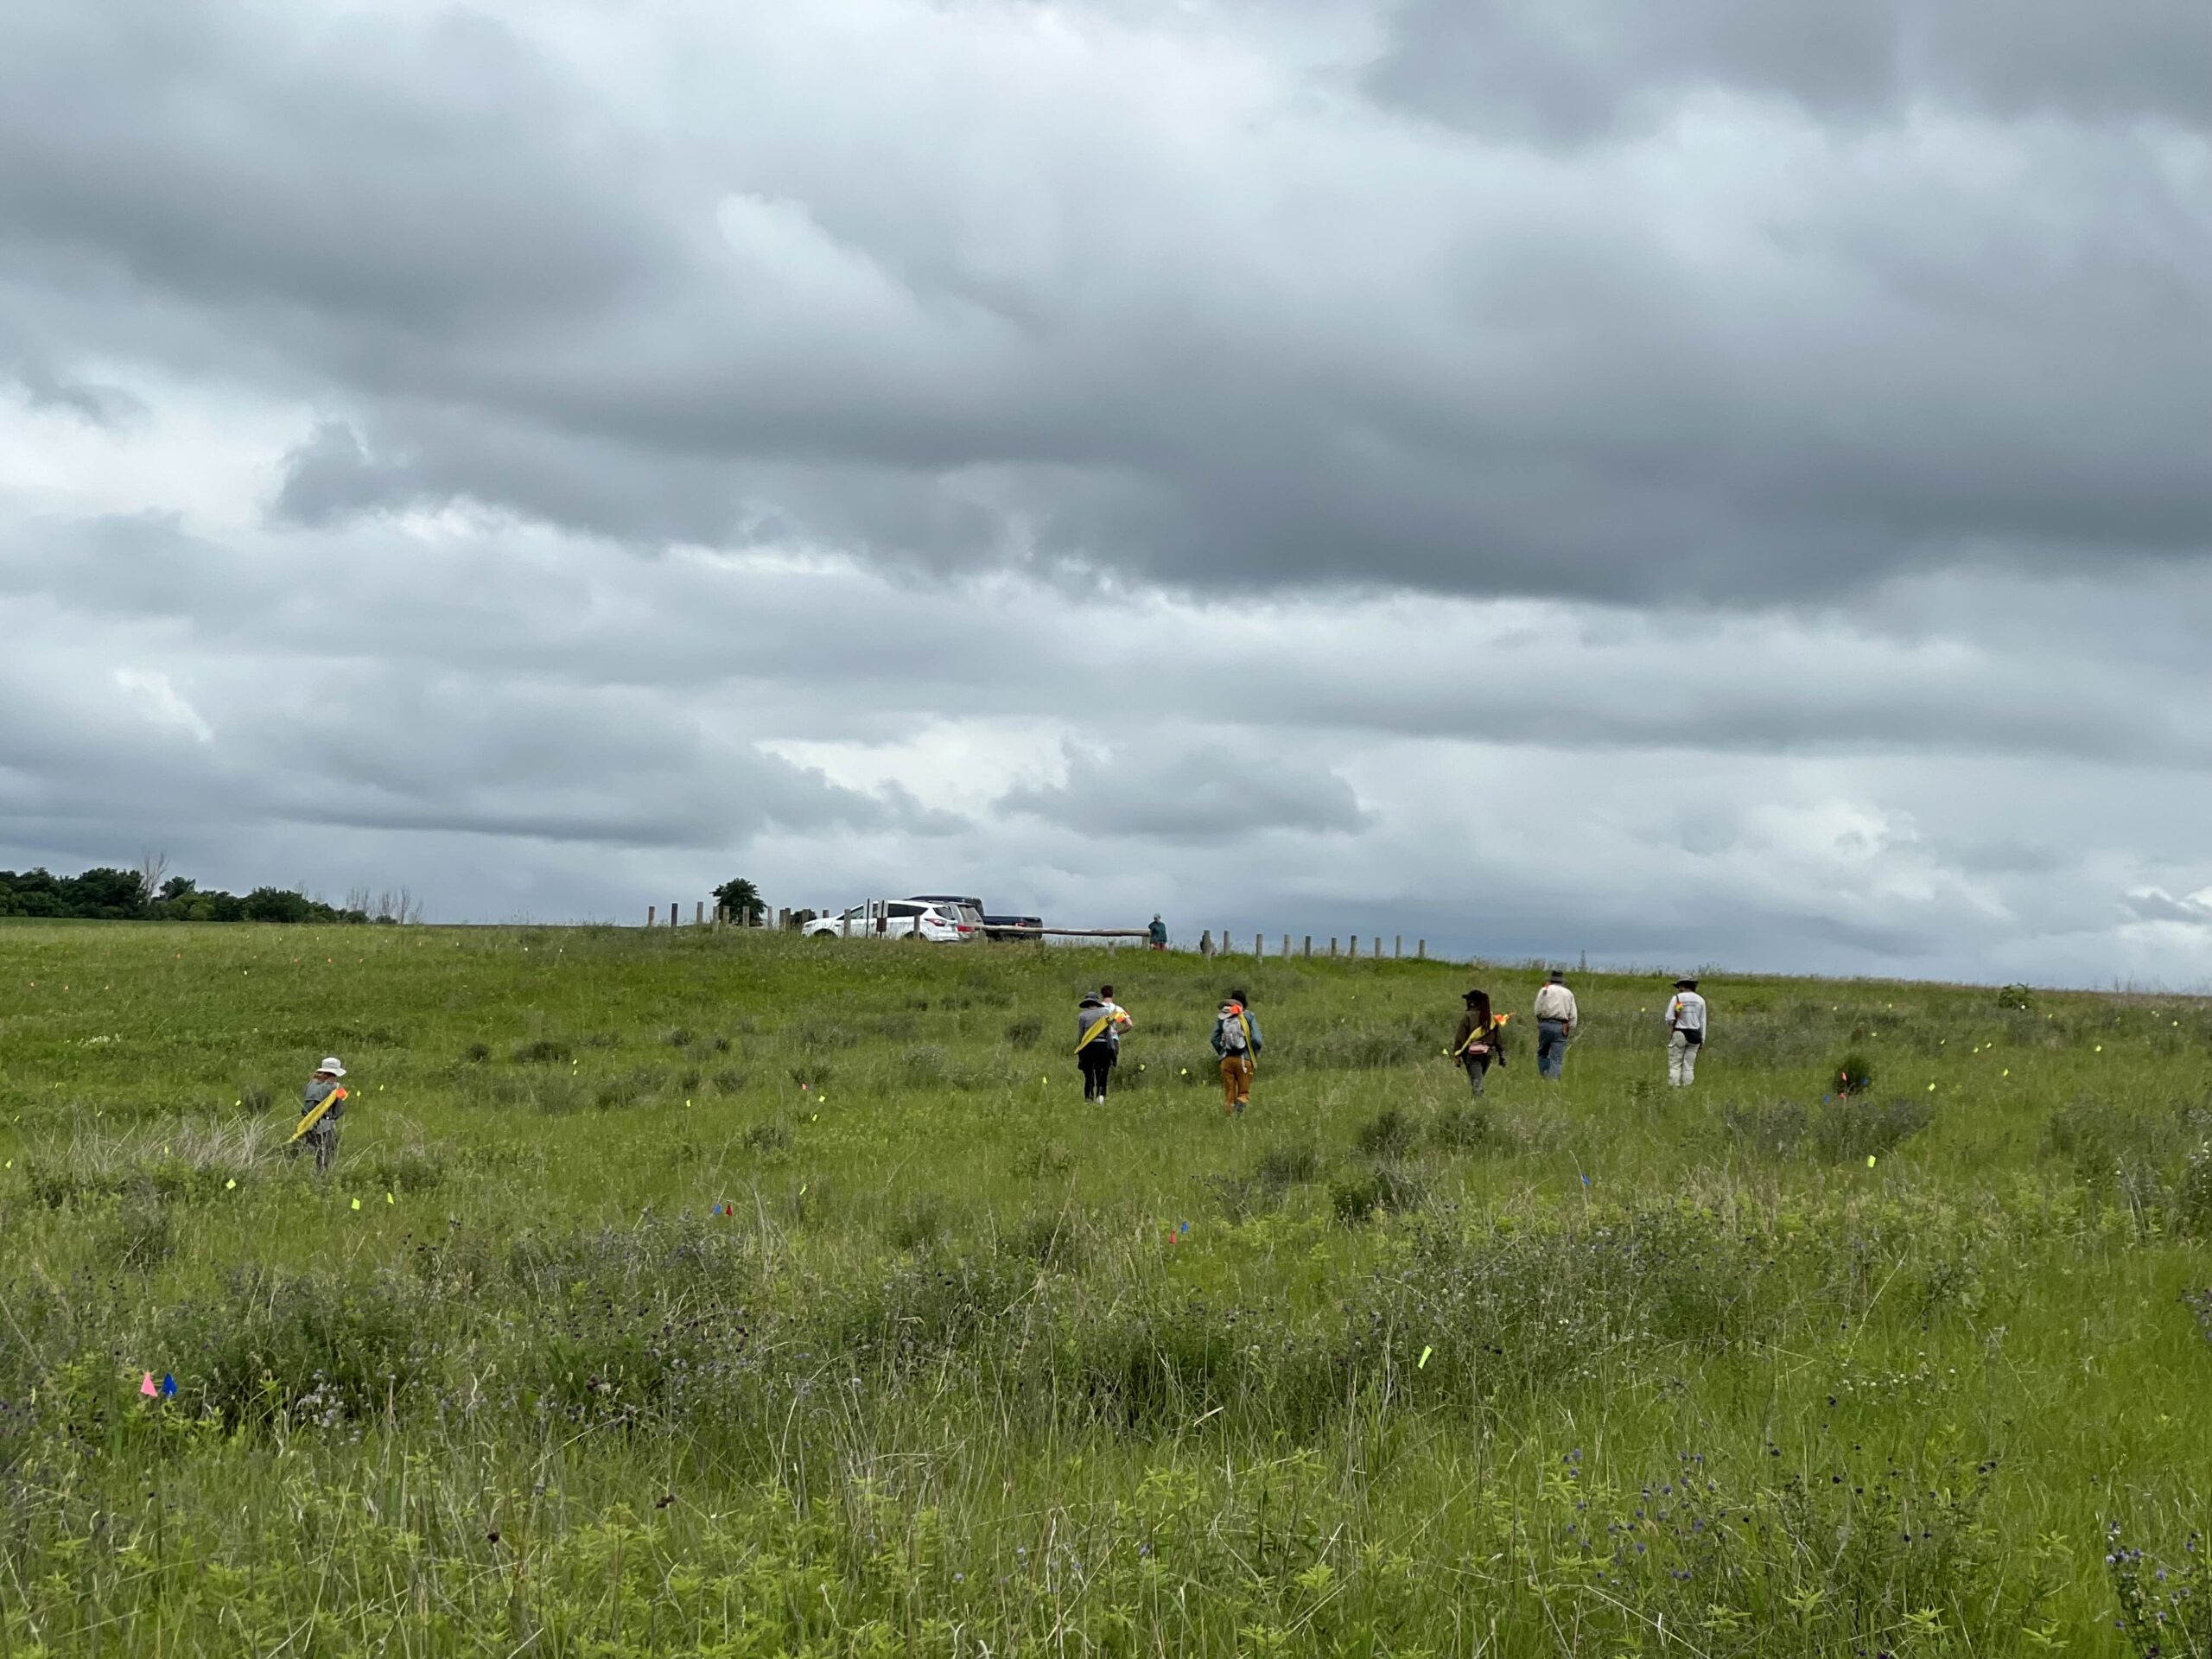
Echinacea pallida is a species of Echinacea that is not native to Minnesota. It was mistakenly introduced to our study area during a restoration of Hegg Lake WMA around 2006 (Stuart’s recollection). This is concerning, because we don’t know how a similar species may impact or local Echinacea angustifolia! Will they hybridize? Could pallida outcompete angustifolia? Ever since pallida have started springing up, Team Echinacea has visited the pallida restoration, taken flowering phenology, and collected demography on the non-native plant. We have decapitated all flowering E. pallida each year to avoid cross-pollination with the local Echinacea angustifolia. Each year, we record the number of heads on each plant and the number of rosettes, collect precise GPS points for each individual, and cut off all the heads before they produce fruits.
This year, we cut E. pallida heads on June 26th. Overall, we found and shot 172 flowering E. pallida plants with 512 normal heads in total, averaging 2.98 heads per plant, though the max was 20 on a single plant! These non-native plants were hearty with an average rosette count of 7.20 rosettes and an astounding individual with a maximum of 88 rosettes. We did not take phenology data on E. pallida this year.
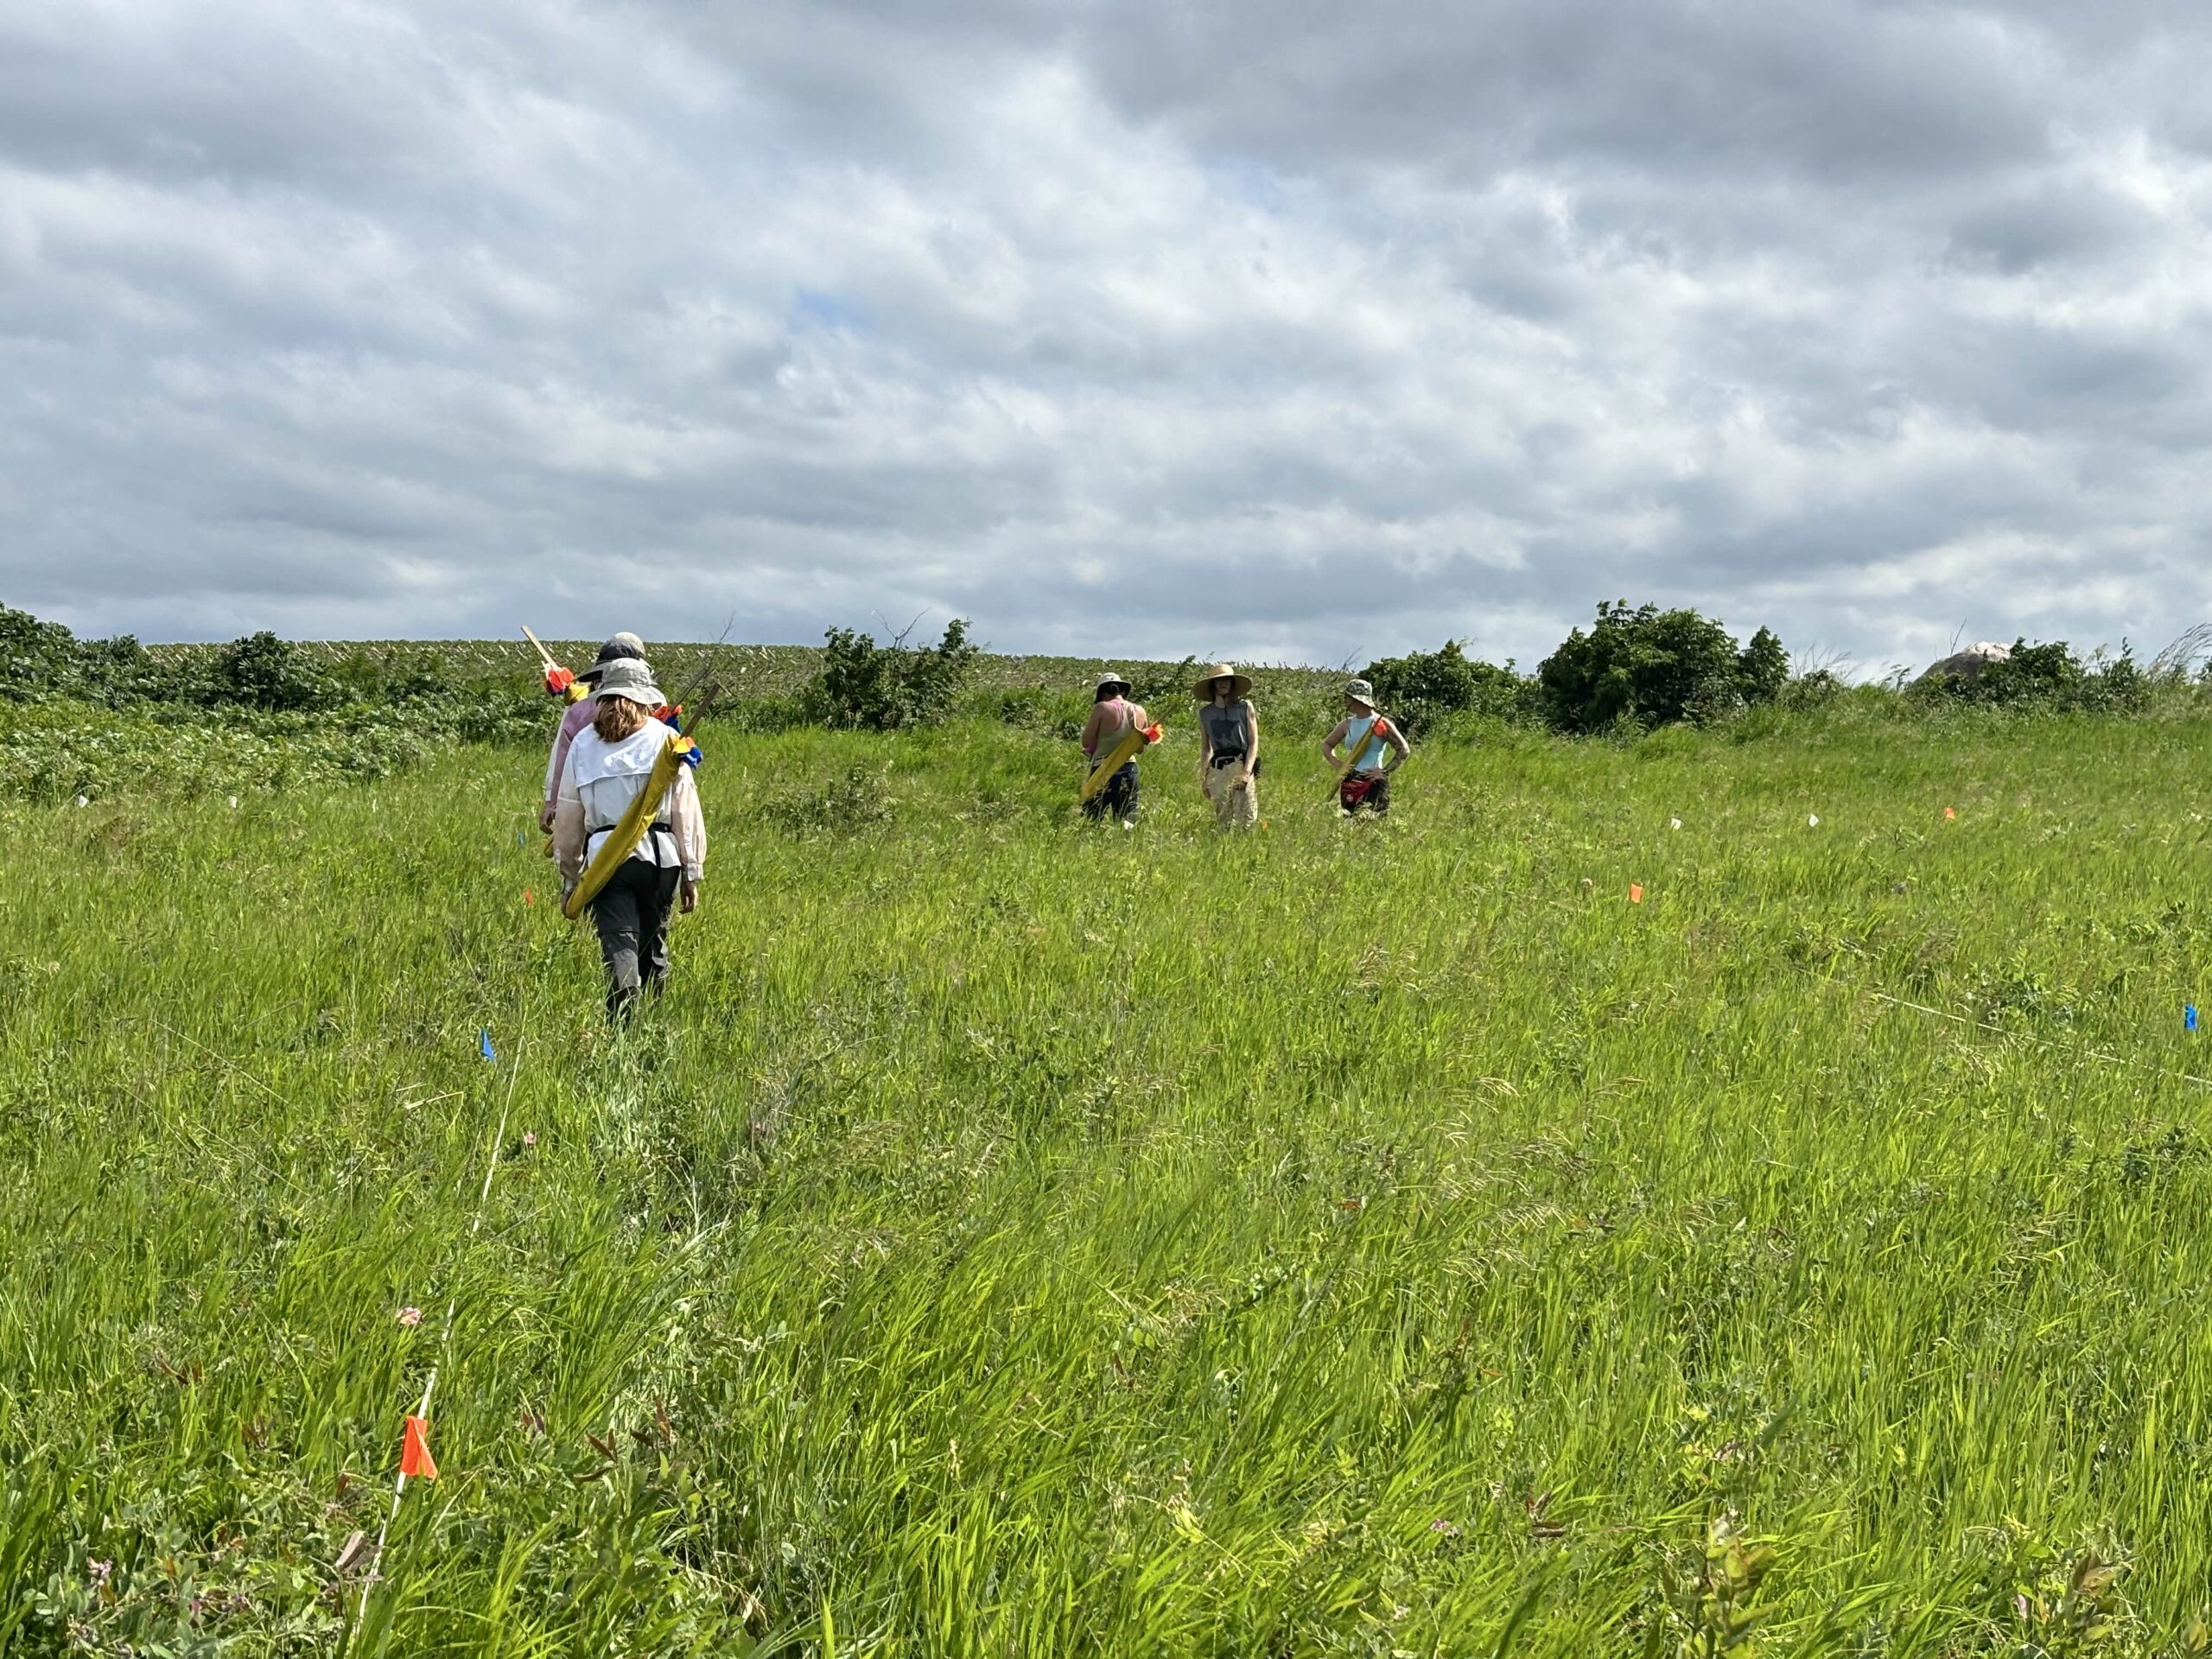
Team 2024 returns to their vehicles after flagging, taking demography data on, and decapitating Echinacea pallida at Hegg Lake WMA
Demography data: head counts, rosette counts, etc.
data in aiisummer2024 repo: ~/aiisummer2024/demo/demoGood2024.txt
Spatial location for every flowering E. pallida
data in aiisummer2024 repo: ~/aiisummer2024/surv/survGood2024.txt
Samples collected:
Echinaceapallida were not collected: decapitated heads were left on the ground next to the plants
A flowering echinacea at the aptly named nearby remnant “near pal” looked suspiciously like a hybrid (more robust than an angustifolia). We put a pollinator exclusion bag on the single head to prevent pollen spread, and later harvested the head and brought it back to the lab, where it is currently in the seed dryer. Keep an eye on tag 29239 in the future
Products:
None… yet! Besides a prairie with significantly less E. pallida reproduction
You can find more information about E. pallida flowering phenology and previous flog posts on the background page for the experiment.
Experimental plot 6 was the first E. angustifolia x E. pallida hybrid plot planted by Team Echinacea. A total of 66 Echinacea hybrids were originally planted. All individuals have E. angustifolia dams and E. pallida sires. In 2024, we visited 23 positions, 4 of which were can’t find year 3 in 2023 and didn’t get their final double check. We found living plants at all positions but those four (so, 19)! Last year, for the first time, 3 plants flowered in this plot. This year, no plants flowered.
Start year: 2011 (crossing) and 2012 (planting)
Location: Wagenius property
Overlaps with:
Common garden experiment
Data collected:
Measure data (status, size, etc.)
data in SQL database
Samples collected:
None (no flowering plants)
Products:
None… yet!
You can find more information about experimental plot 6 and previous flog posts about it on the background page for the experiment.
Experimental plot 7 is the second E. pallida x E. angustifolia plot. It contains conspecific crosses of each species as well as reciprocal hybrids, totaling 294 pdeigreed individuals. We took phenology records between July 10th and July 18th. There were 42 flowering plants this year; from these we harvested 87 heads. Heads in this plot were covered by pollinator exclusion bags during the growing season to prevent cross-pollination with nearby Echinacea populations.
Stuart demonstrates proper measuring technique in exPt07
Start year: 2012 (crossing) and 2013 (planting)
Location: Hegg Lake WMA (MN DNR)
Overlaps with:
Common garden experiment
Data collected:
Phenology data (dates of flowering stages)
data in cgData repo: ~/cgData/summer2024/exPt79Phenology
Measure data (status, size, etc.)
data in SQL database
Harvest data (IDs of harvested heads, missing achenes, etc)
detailed data in dropbox: dropbox/CGData/140_reconcile/reconcile2024/reconcileOut/2024harvestListReconciledExport.csv
data in echinaceaLab package (hh.2024)
Samples collected:
87 heads harvested
at CBG for processing
Products:
None… yet!
You can find more information about experimental plot 7 and previous flog posts about it on the background page for the experiment.
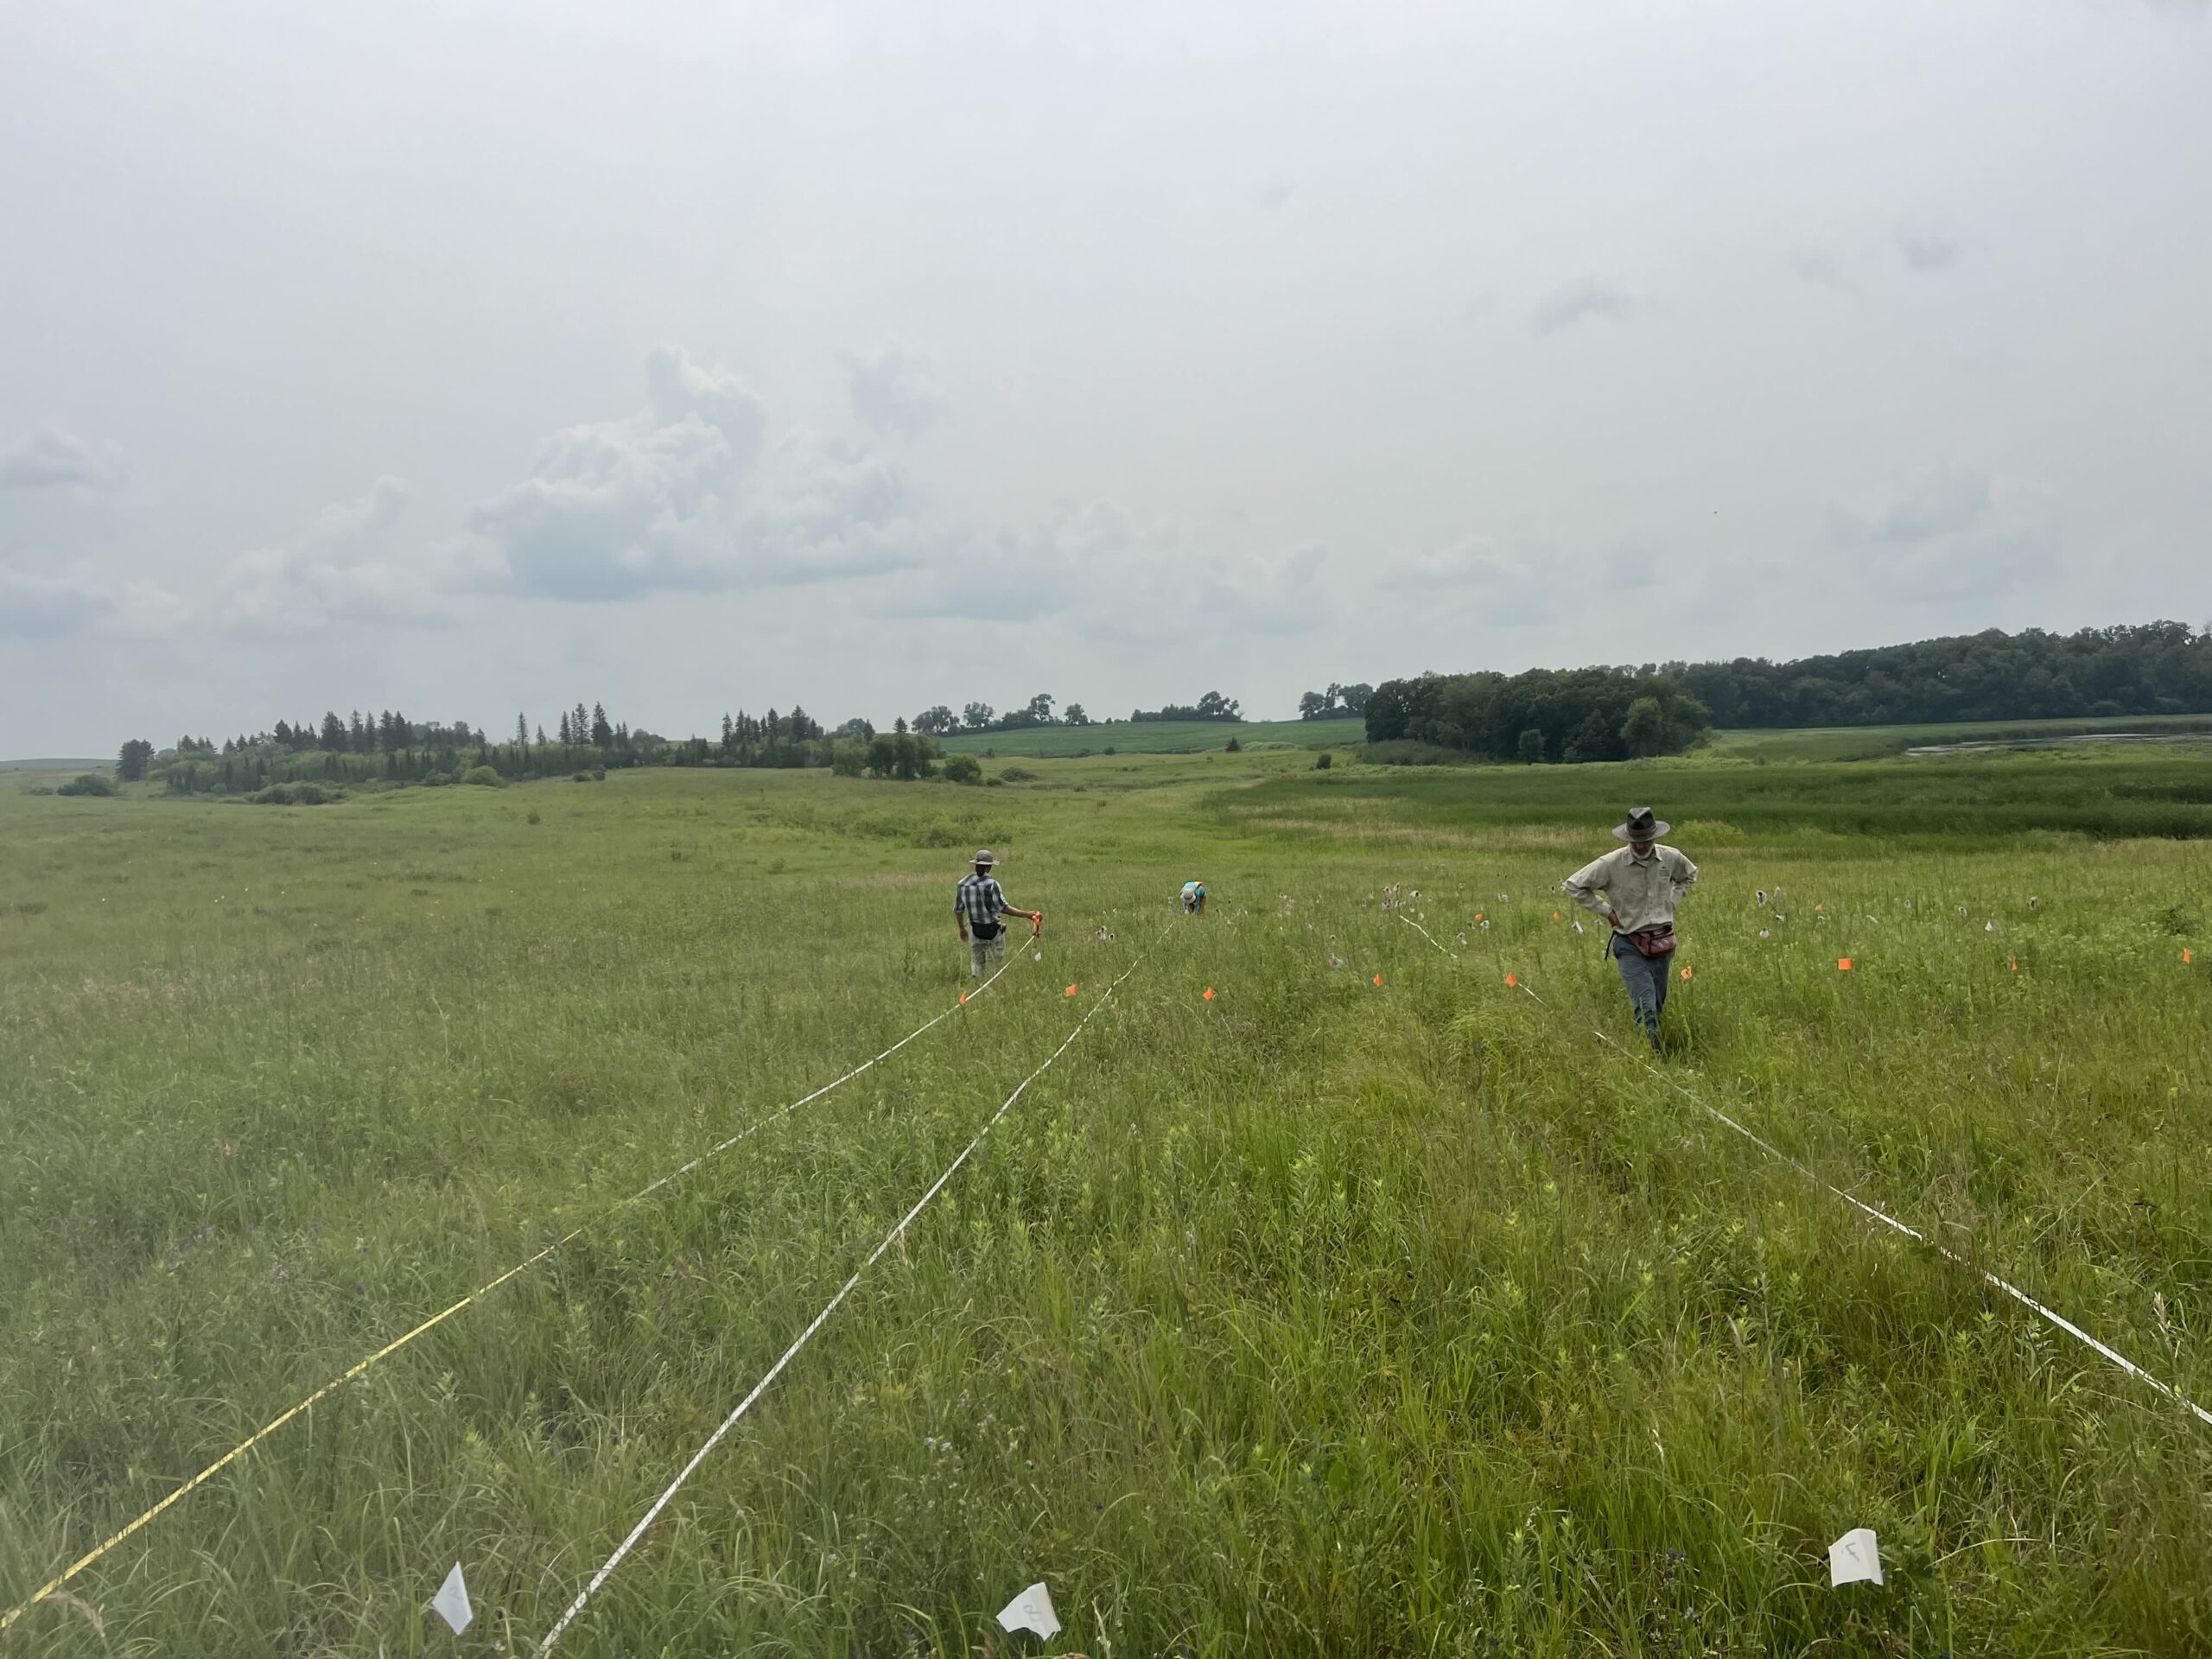
There were originally 745 seedlings planted in exPt09. Experimental plot 9 is a hybrid plot, but, unlike the other two hybrid plots, we do not have a perfect pedigree of the plants. That is because the E. angustifolia and E. pallida maternal plants used to generate seedlings for exPt09 were open-pollinated. At this point, some but not all plants in this plot were tested for paternity, revealing that there are some hybrids. This year, we took phenology records between July 9th and July 18th. During measuring, we searched at 292 positions and found evidence of 234 living plants in 2024. Of these individuals, 70 were flowering. We harvested 110 heads from this plot! Heads in this plot were covered by pollinator exclusion bags during the growing season to prevent cross-pollination with nearby Echinacea populations.
The team runs out reel tapes to aid in measuring exPt09
Start year: 2014
Location: Hegg Lake WMA (MN DNR)
Overlaps with:
Common garden experiment
Data collected:
Phenology data (dates of flowering stages)
data in cgData repo: ~/cgData/summer2024/exPt79Phenology
Measure data (status, size, etc.)
data in SQL database
Harvest data (IDs of harvested heads, missing achenes, etc)
detailed data in dropbox: dropbox/CGData/140_reconcile/reconcile2024/reconcileOut/2024harvestListReconciledExport.csv
data in echinaceaLab package (hh.2024)
Samples collected:
110 heads harvested
at CBG for processing
Products:
None… yet!
You can find out more information about experimental plot 9 and flog posts mentioning the experiment on the background page for the experiment.
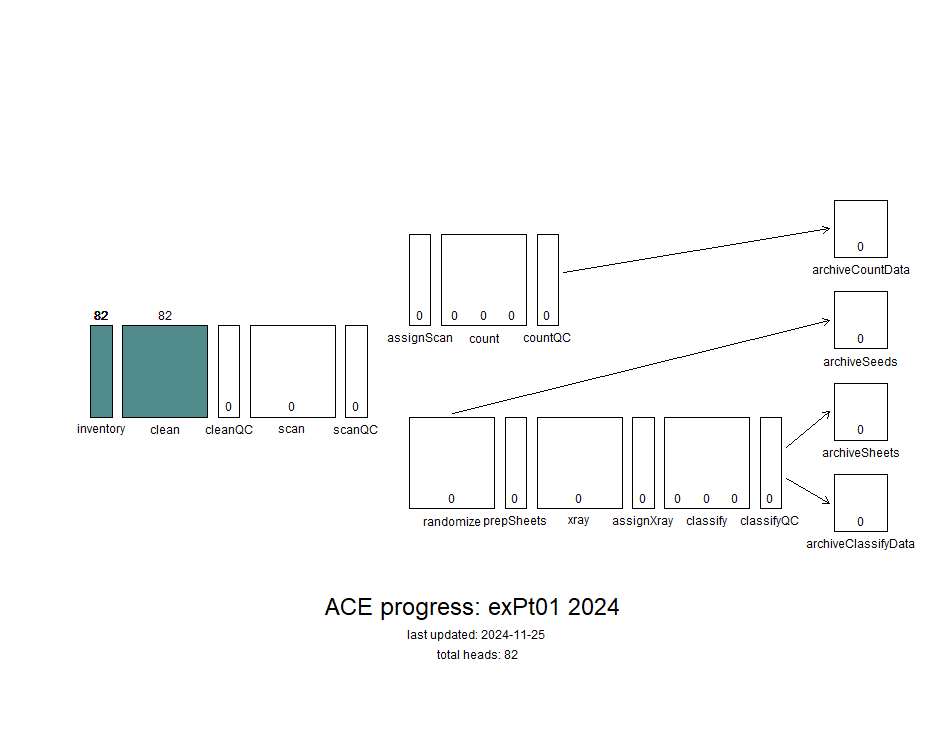
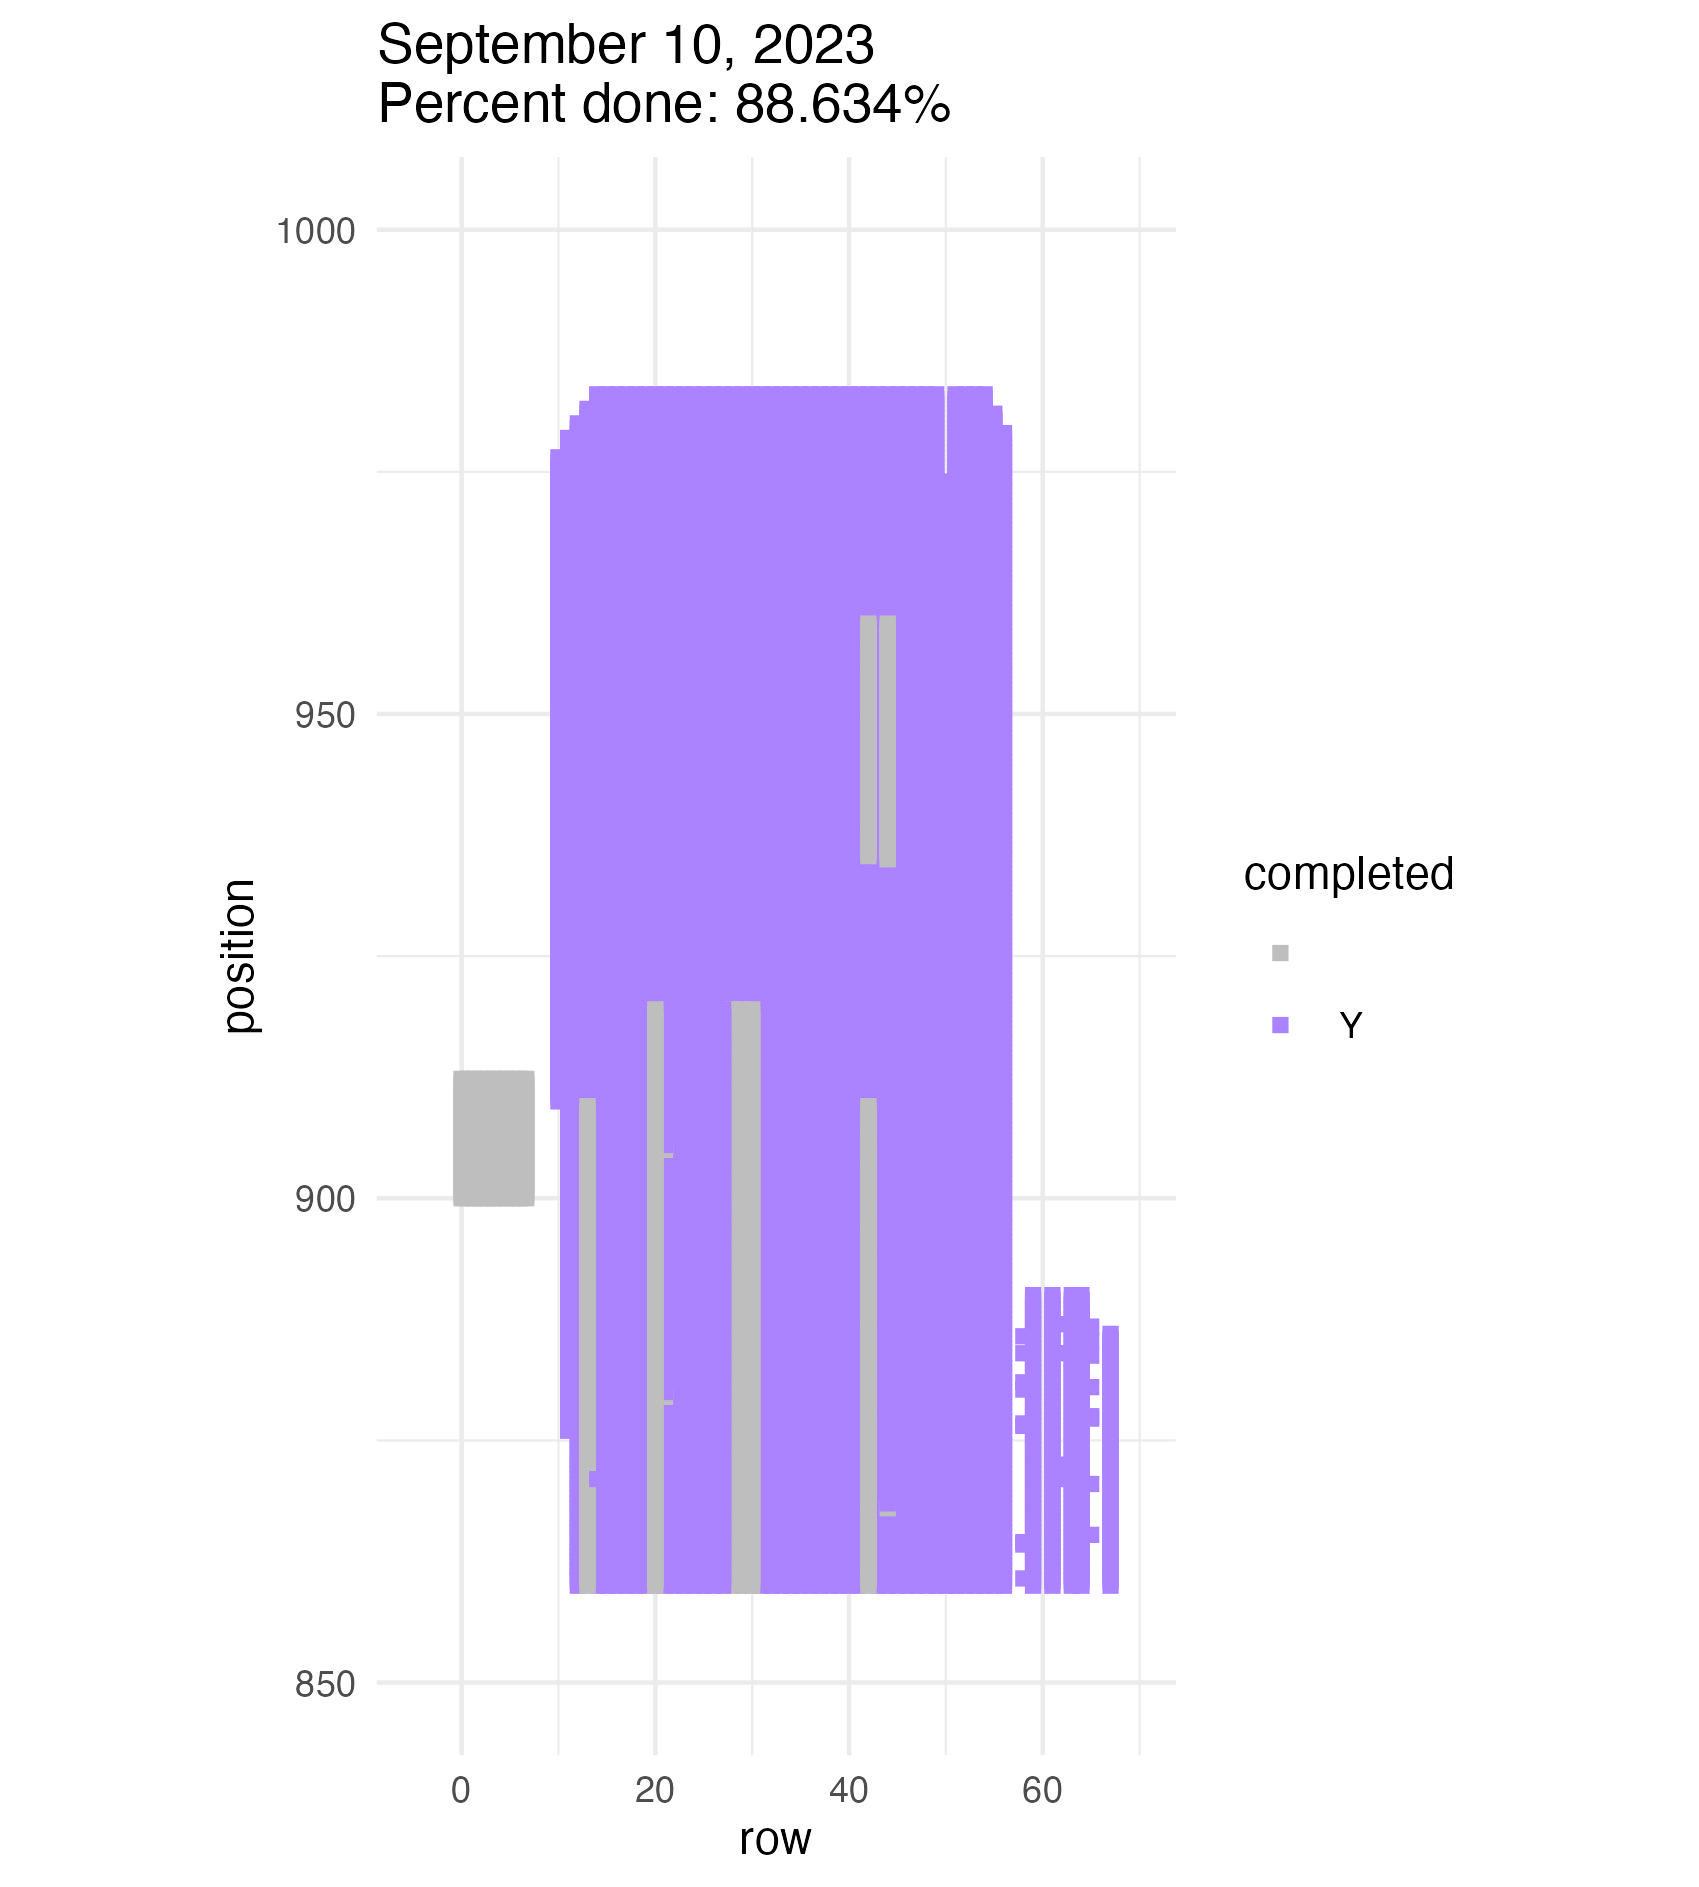
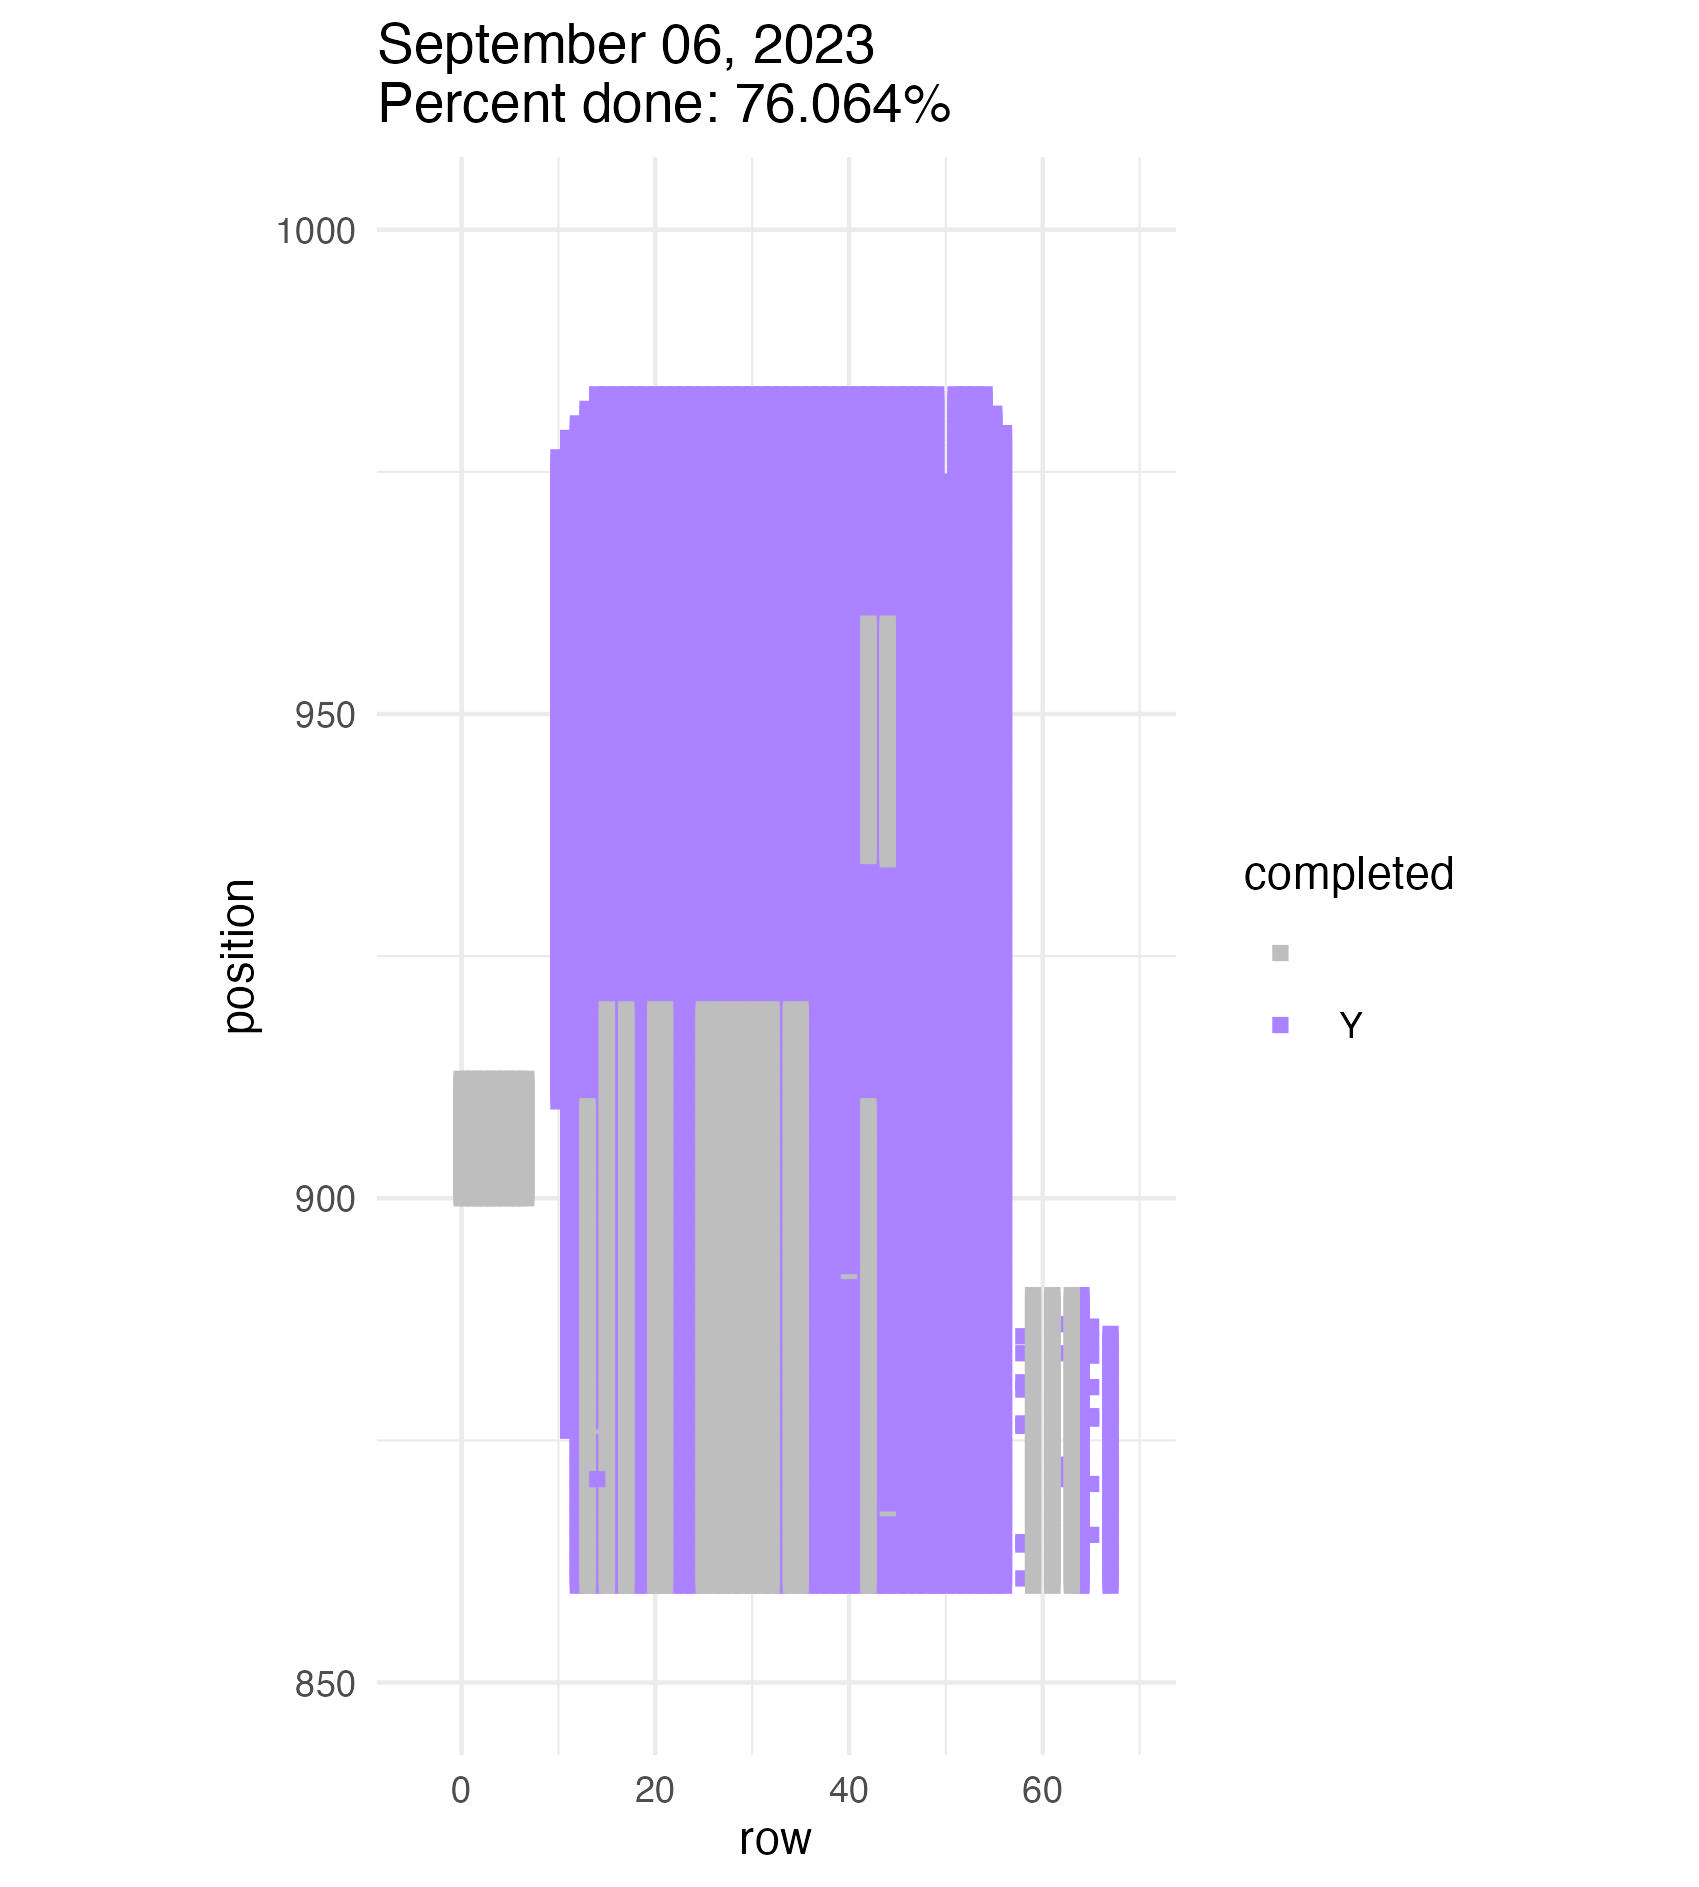
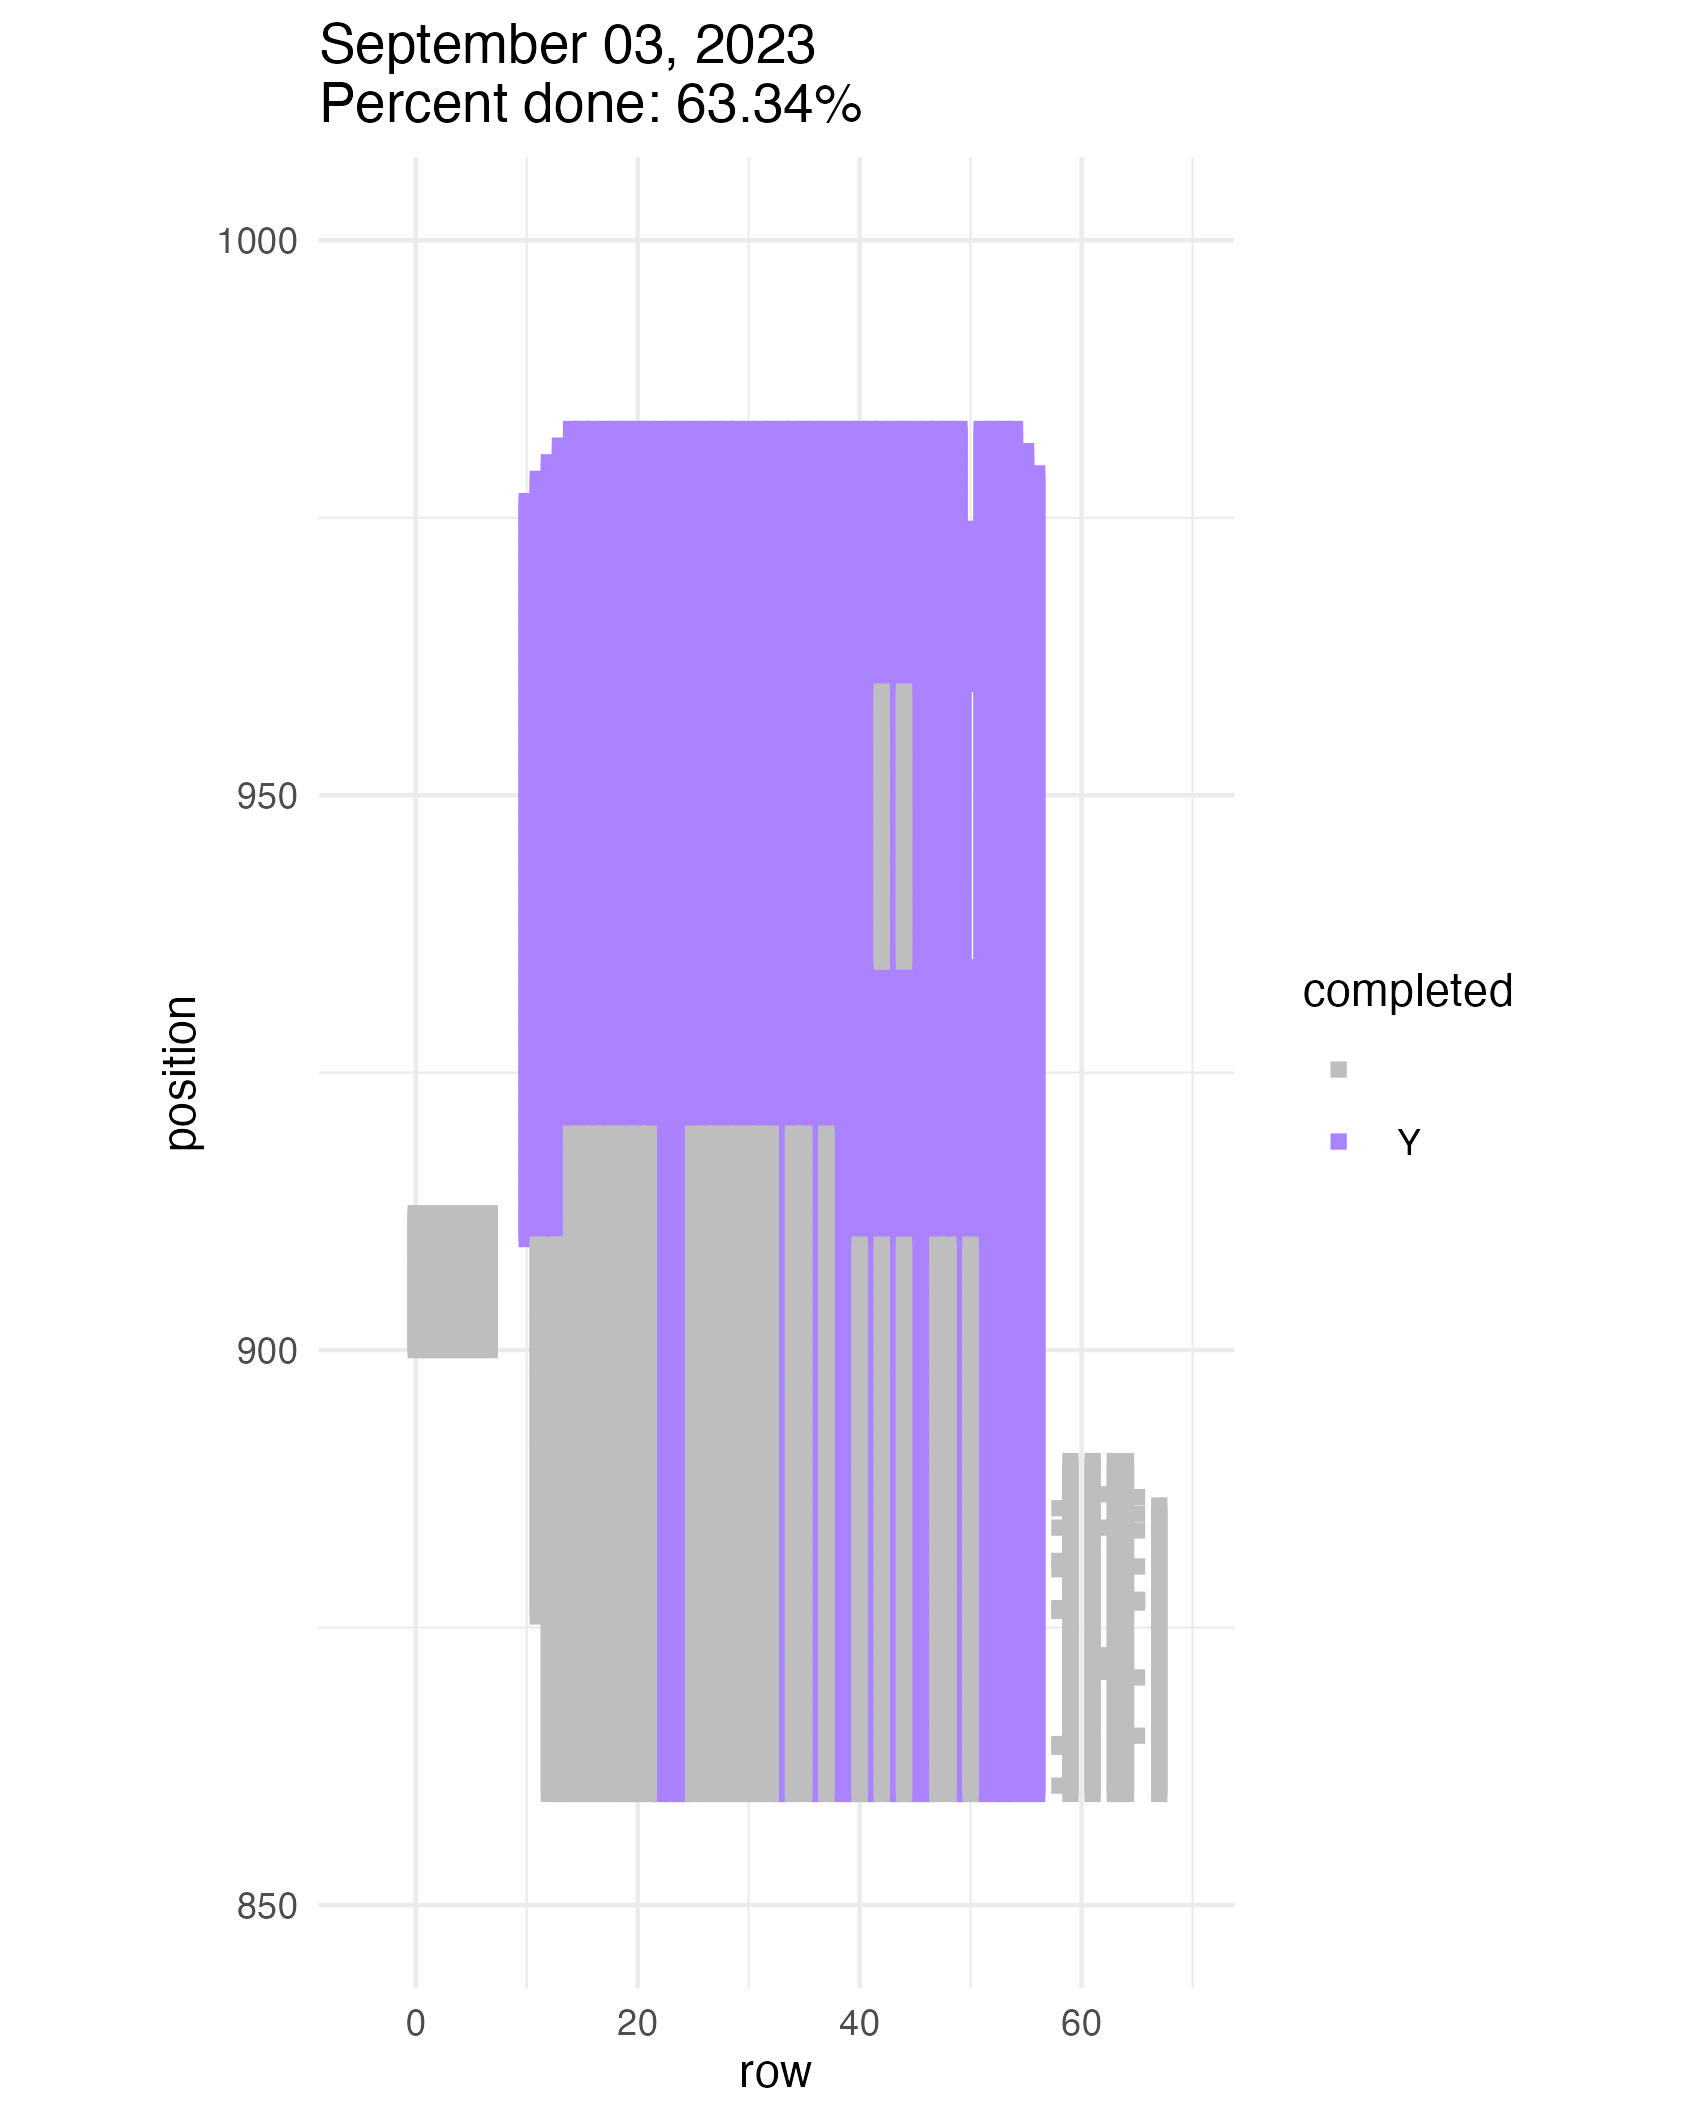
We have a few experiments that we’re prioritizing here in the lab. We want to get the heads in these experiments through our ACE process as quickly as possible! One of these experiments is known by many names: q1, qGen, qGen1, big batch, etc. The experiment in question was planted in experimental plot 1 in 2003 and was designed to investigate the heritability of fitness using a quantitative genetics approach. We’re looking to redo the analysis we have on this experiment with several new years of data, including 2024!
This year, very few plants in exPt01 flowered, so all experiments in that plot were lumped into one for ACE processing. I booted up Alex’s ACE progress visualization machine to see what our progress on this batch looks like so far! We only need to get this batch through counting, so we can skip the randomizing/xray/classifying steps.
Finished with cleaning! Rechecking (here cleanQC) is up next.
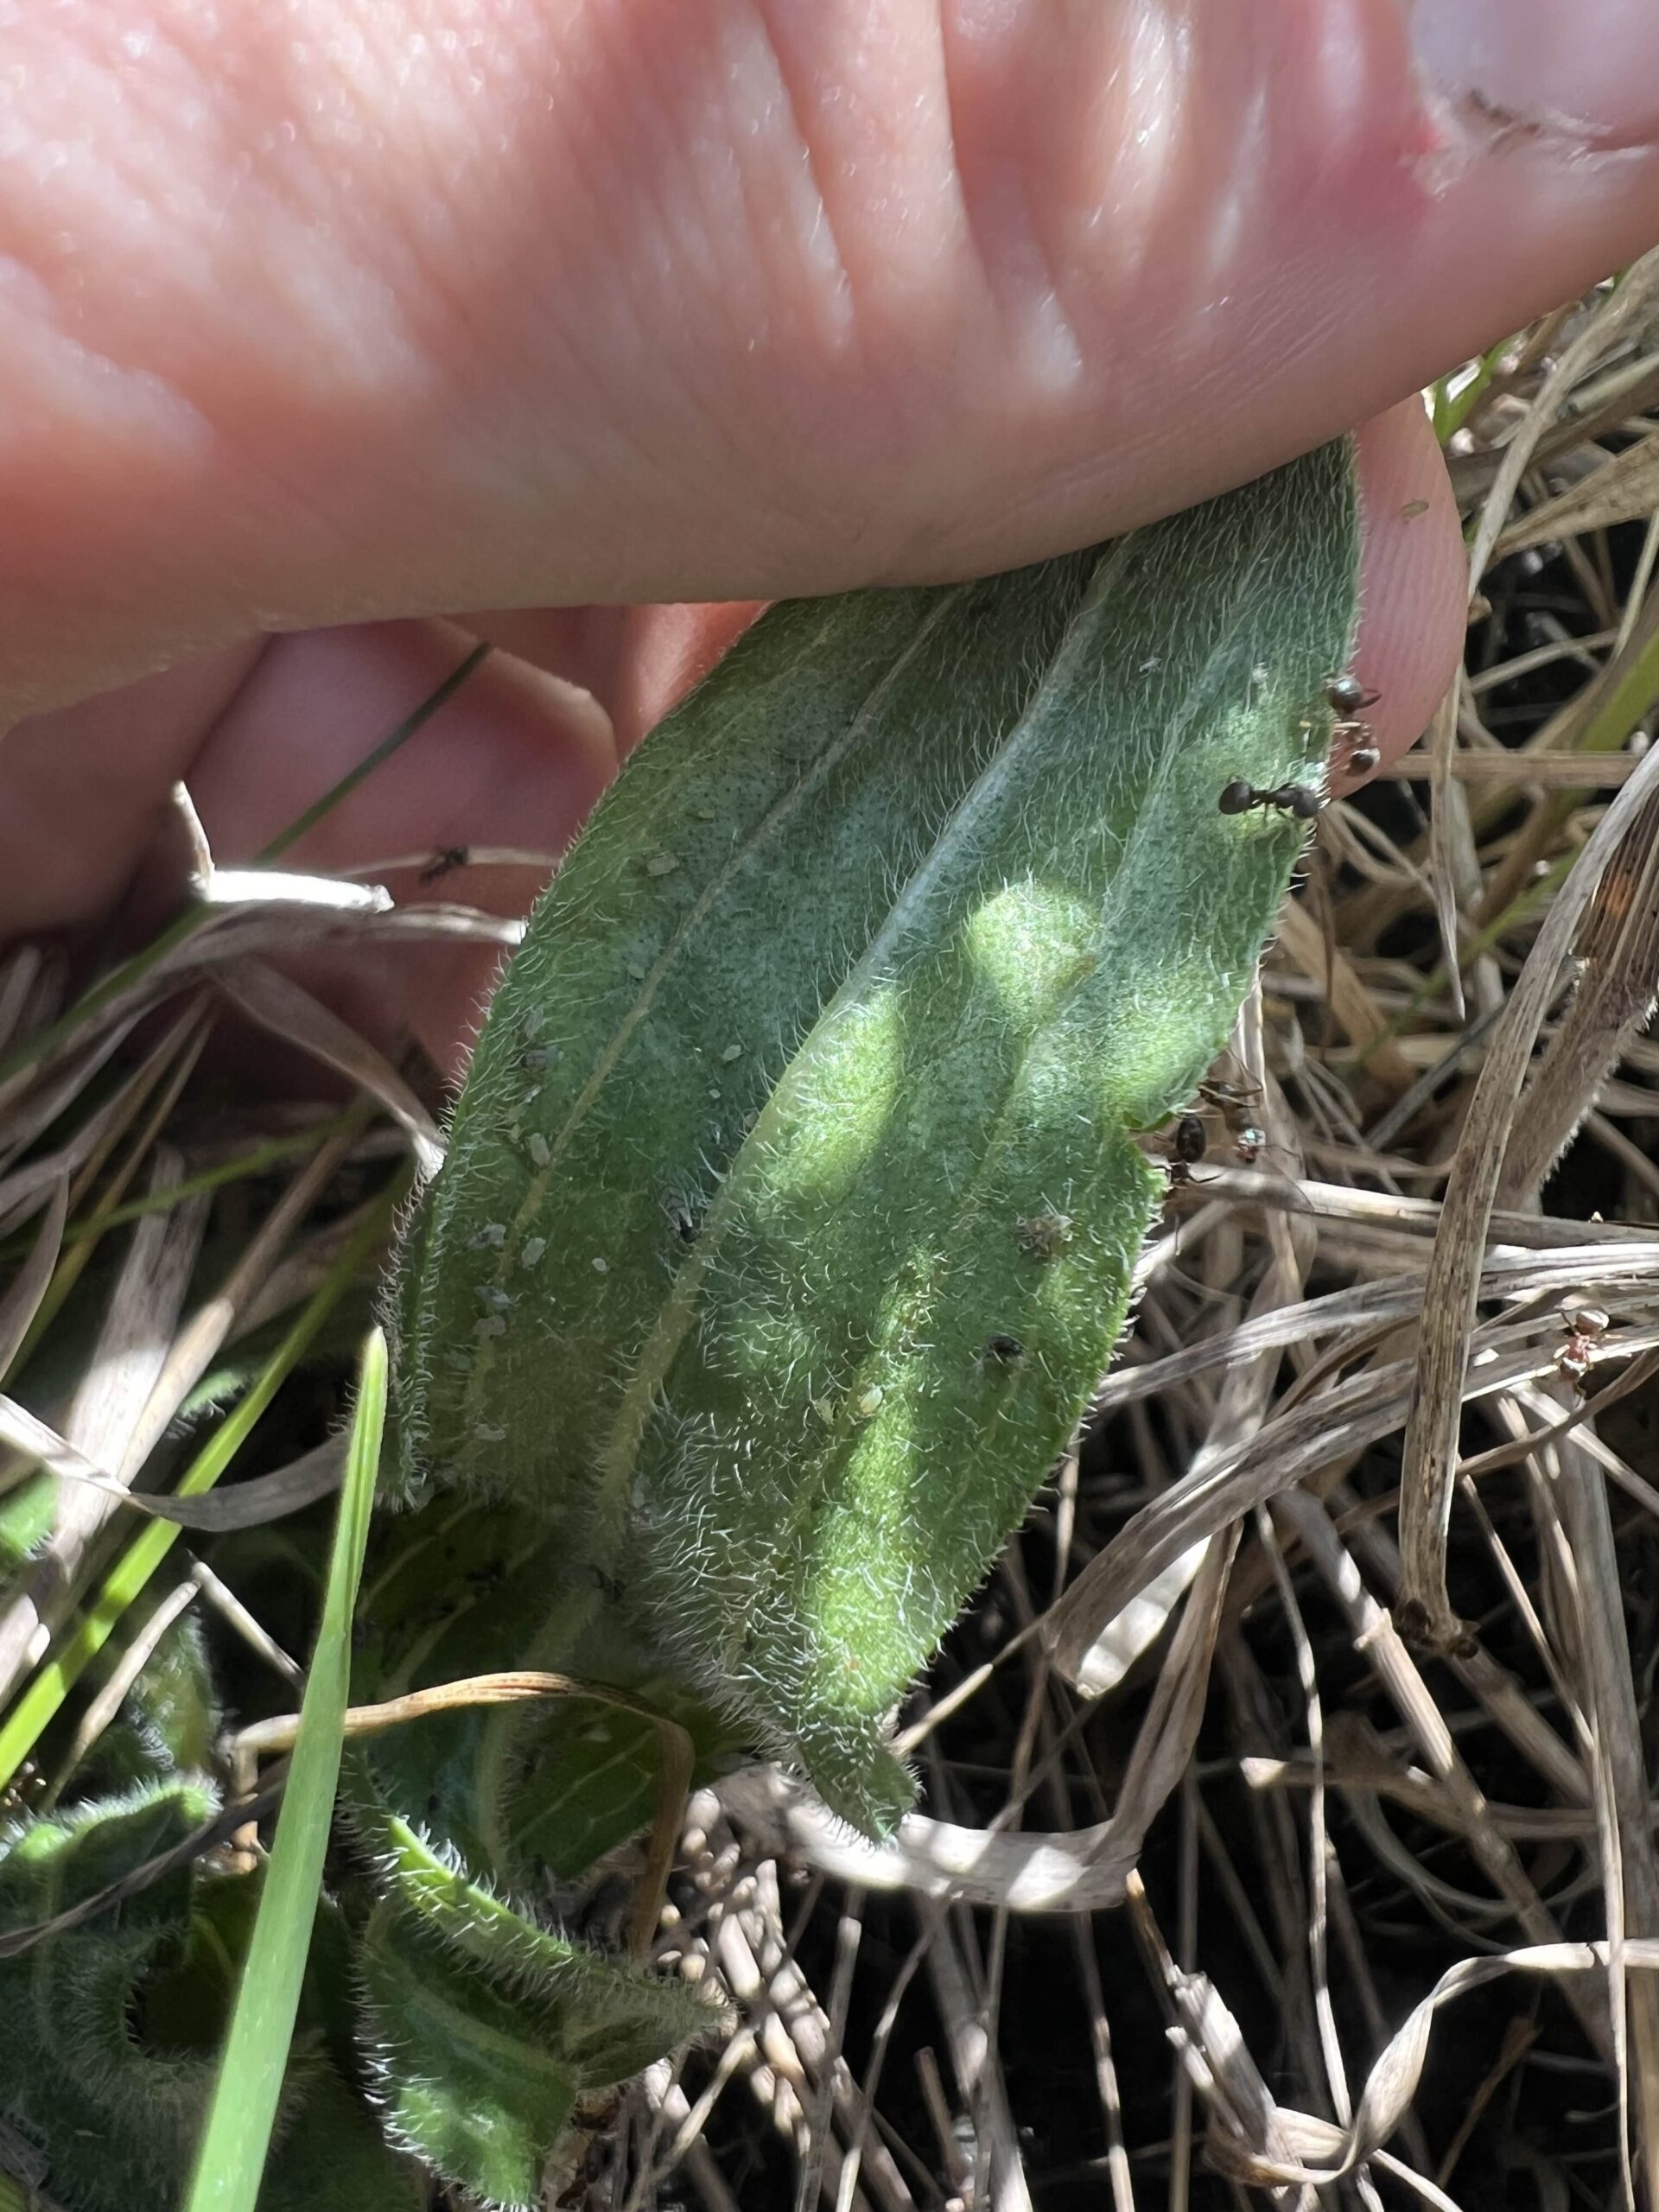
The aphid addition and exclusion experiment was started in 2011 by Katherine Muller. The original experiment included 100 plants selected from exPt01 that were each assigned to have aphids either added or excluded across multiple years. The intention is to assess the impact of the specialist herbivore Aphis echinaceae on Echinacea fitness.
In 2024, 41 of the original 100 plants were alive, two of which flowered. However, we did not see any aphids anywhere while measuring exPt01. We have not conducted fieldwork for this experiment since 2022, when team members Emma Reineke and Kennedy Porter were in charge of the experiment and did not find any aphids in exPt01, so they introduced a new population of Aphid echinaeceae into the plot. Learn more in the 2022 summer aphid update.
Aphids Wyatt Mosiman saw in exPt02 this summer. Wrong plot, aphids!
Plant survival and measurements were recorded as part of our annual surveys in P1 and eventually will be found in our SQL database.
Samples collected:
2 heads from plants included in this experiment are at the Chicago Botanic Garden awaiting processing: AD-1728 and AZ-1744 in the exPt01 2024 batch
Products:
Andy Hoyt’s poster presented at the Fall 2018 Research Symposium at Carleton College
2016 paper by Katherine Muller and Stuart Wagenius on aphids and foliar herbivory damage on Echinacea
2015 paper by Ruth Shaw and Stuart Wagenius on fitness and demographic consequences of aphid loads
You can read more about the aphid addition and exclusion experiment, as well as links to prior flog entries mentioning the experiment, on the background page for this experiment.
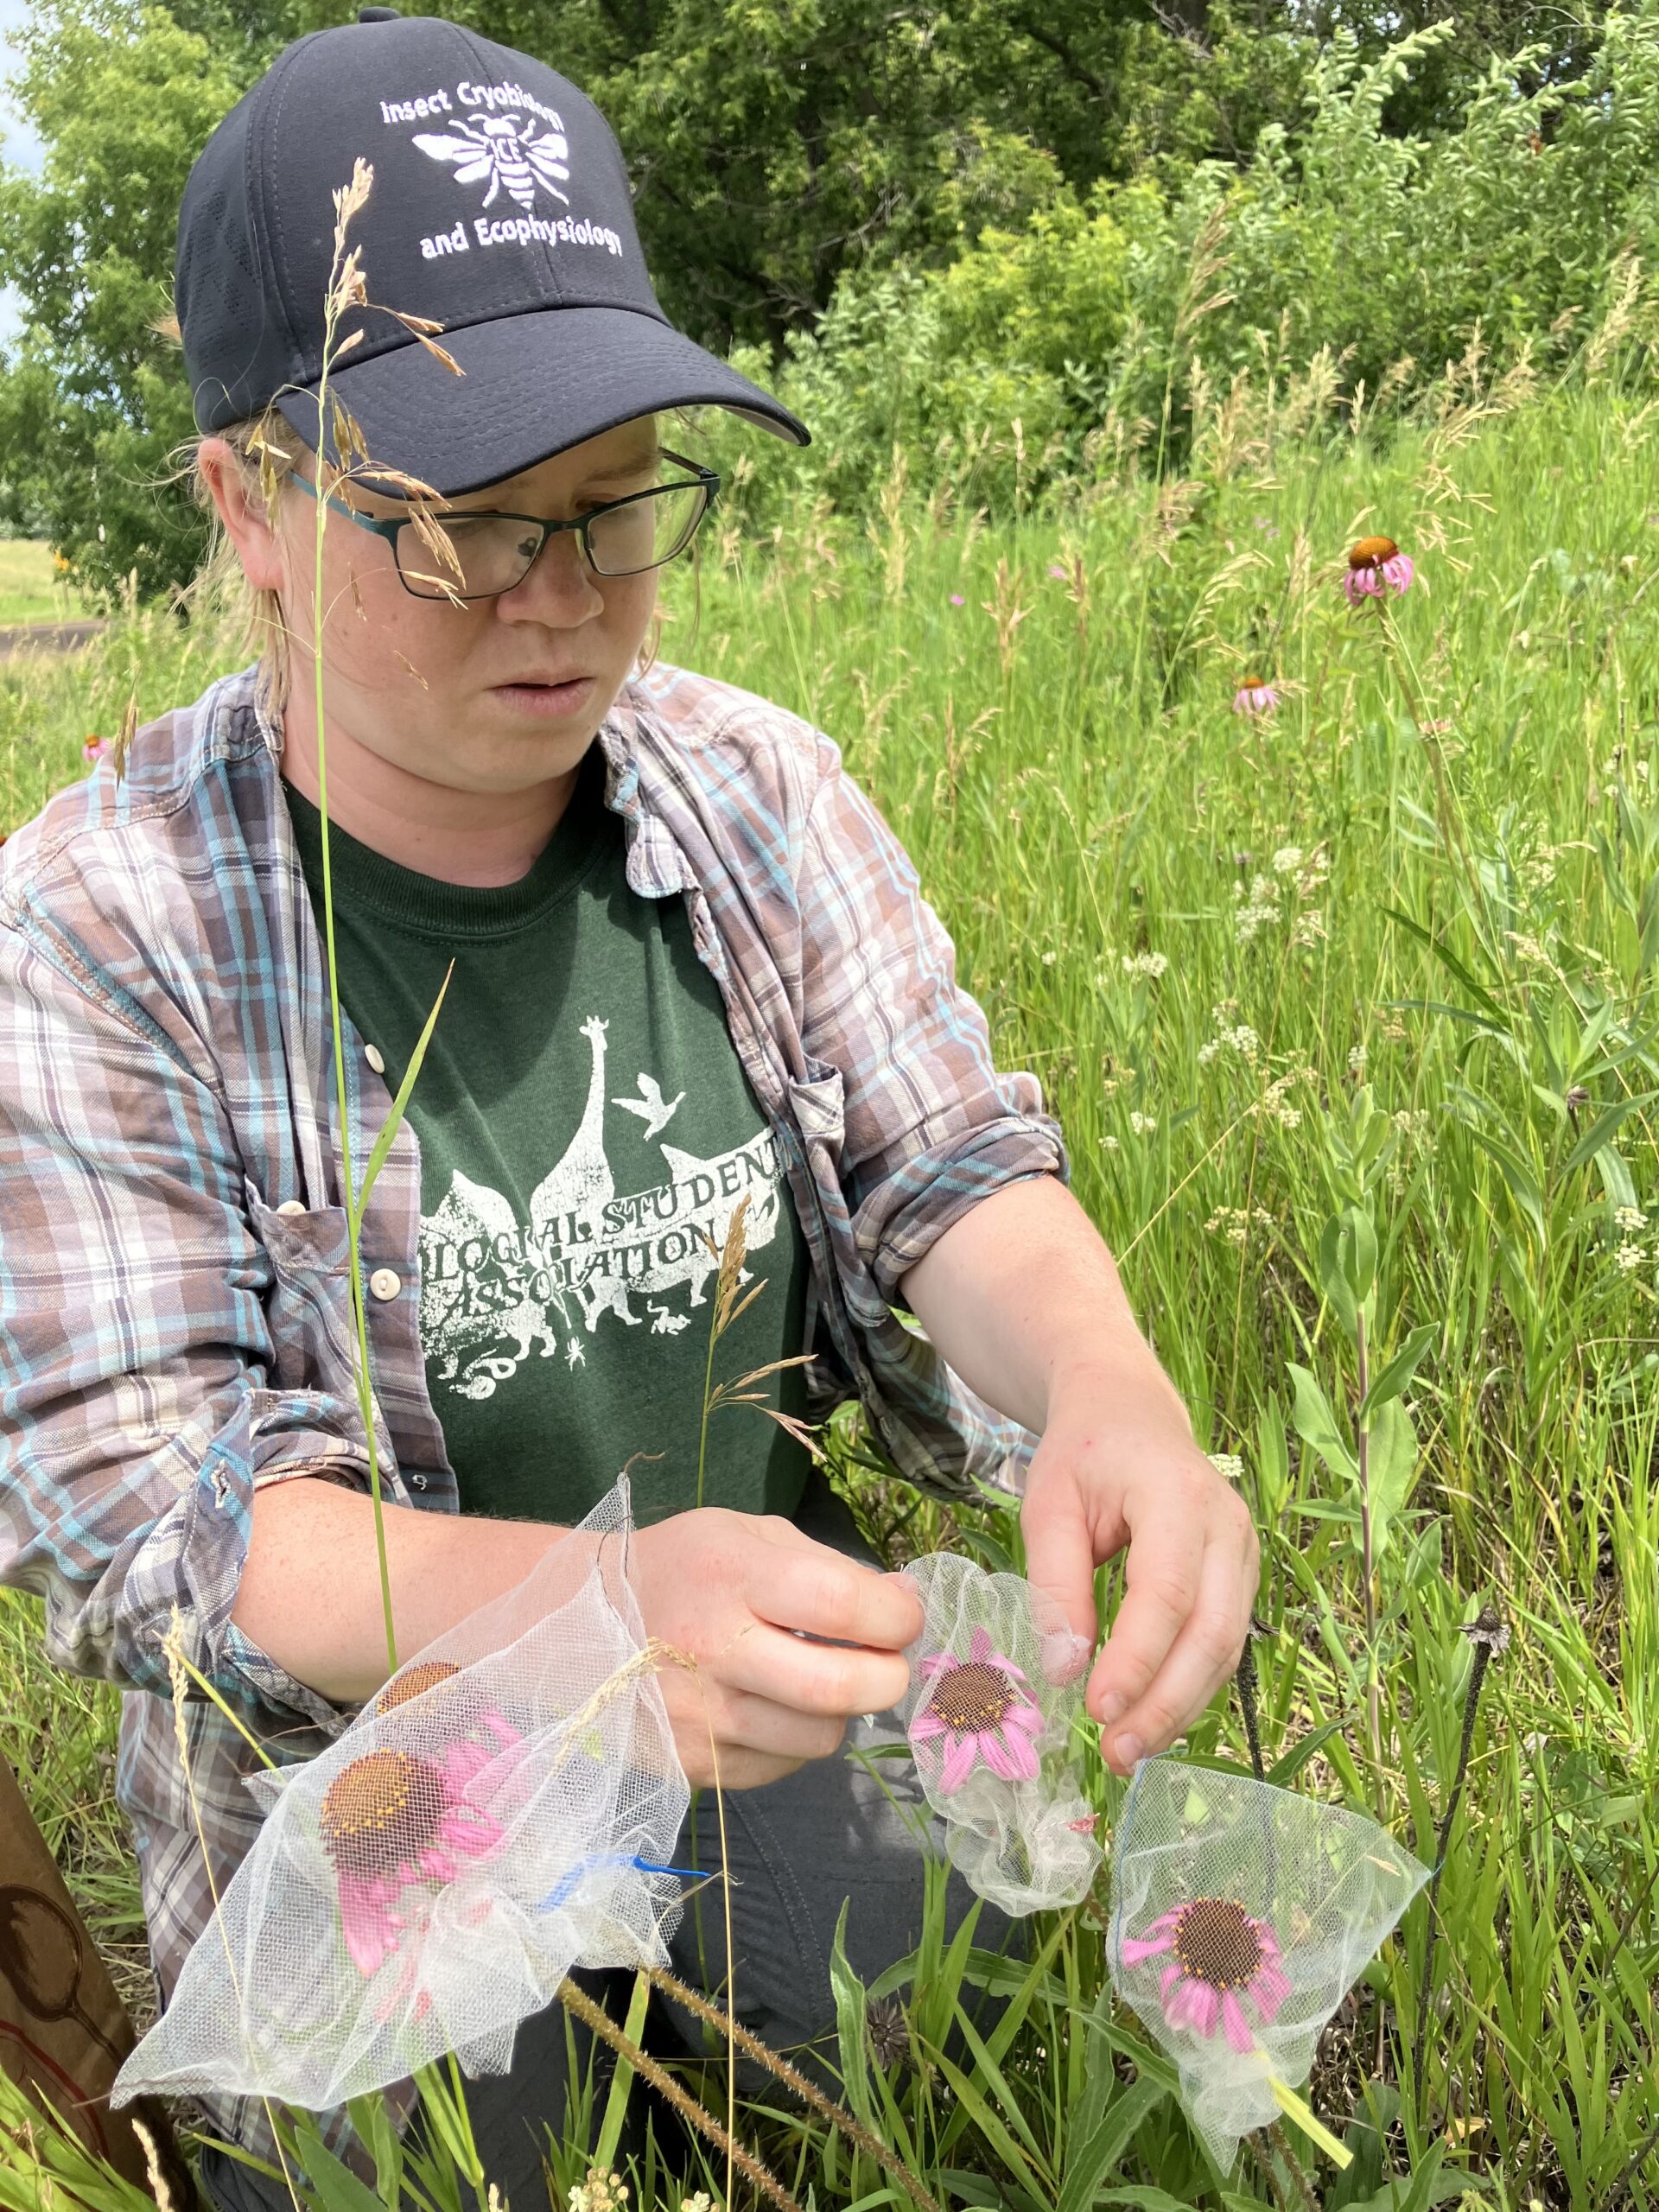
Reproduction in plants can be limited by access to pollen and resources. We previously found that Echinacea plants in the remnants are pollen limited, meaning that if they had access to more pollen, they would produce more seeds. However, the long-term effects of pollen limitation are unknown. Do plants that are super pollen saturated and have high amounts of pollen have a higher lifetime fitness than plants that are pollen limited? Also, we know that the plants in the remnants are pollen limited, but are the plants in the common garden environment also pollen limited? To answer these questions and more, 13 years ago Gretel randomly selected 39 plants from p1; half of these plants were randomly assigned to the pollen addition group, and the others were assigned to pollen exclusion. Every year, plants in the pollen exclusion have their heads bagged and they are not pollinated, while we hand cross every style in the pollen addition group. An additional 53 plants in p1 were selected to be part of a control group where pollen was neither added nor excluded.
In the summer of 2024, NONE of the original 39 addition/exclusion plants were flowering. If any had been flowering, the exclusion treatment plants would be covered with exclusion bags to prevent pollination, and the addition plants would be hand-pollinated multiple times throughout the summer. One plant in the control group produced a single flowering head.
Collaborator and NDSU postdoc Grace Hirzel places pollinator exclusions bags on Echinacea heads in the remnants. If any of the plants in the polLim experiment from the non-control group had flowered this year, it would’ve looked like this!
You can find more information about the pollen addition and exclusion experiment and links to previous flog posts regarding this experiment at the background page for the experiment.
2024 was a relatively low-flowering year in the common gardens, but that doesn’t mean we didn’t bring plenty of Echinacea heads back to the lab for our volunteers! Here are our stats:
TOTAL: 689heads
exPt01: 82 heads (11.9%)
exPt02: 375 heads (54.4%)
exPt07: 87 heads (12.6%)
exPt08: 23 heads (3.3%)
exPt09: 110 heads (16.0%)
tplot: 12 heads (1.7%)
(rounding errors in %s abound)
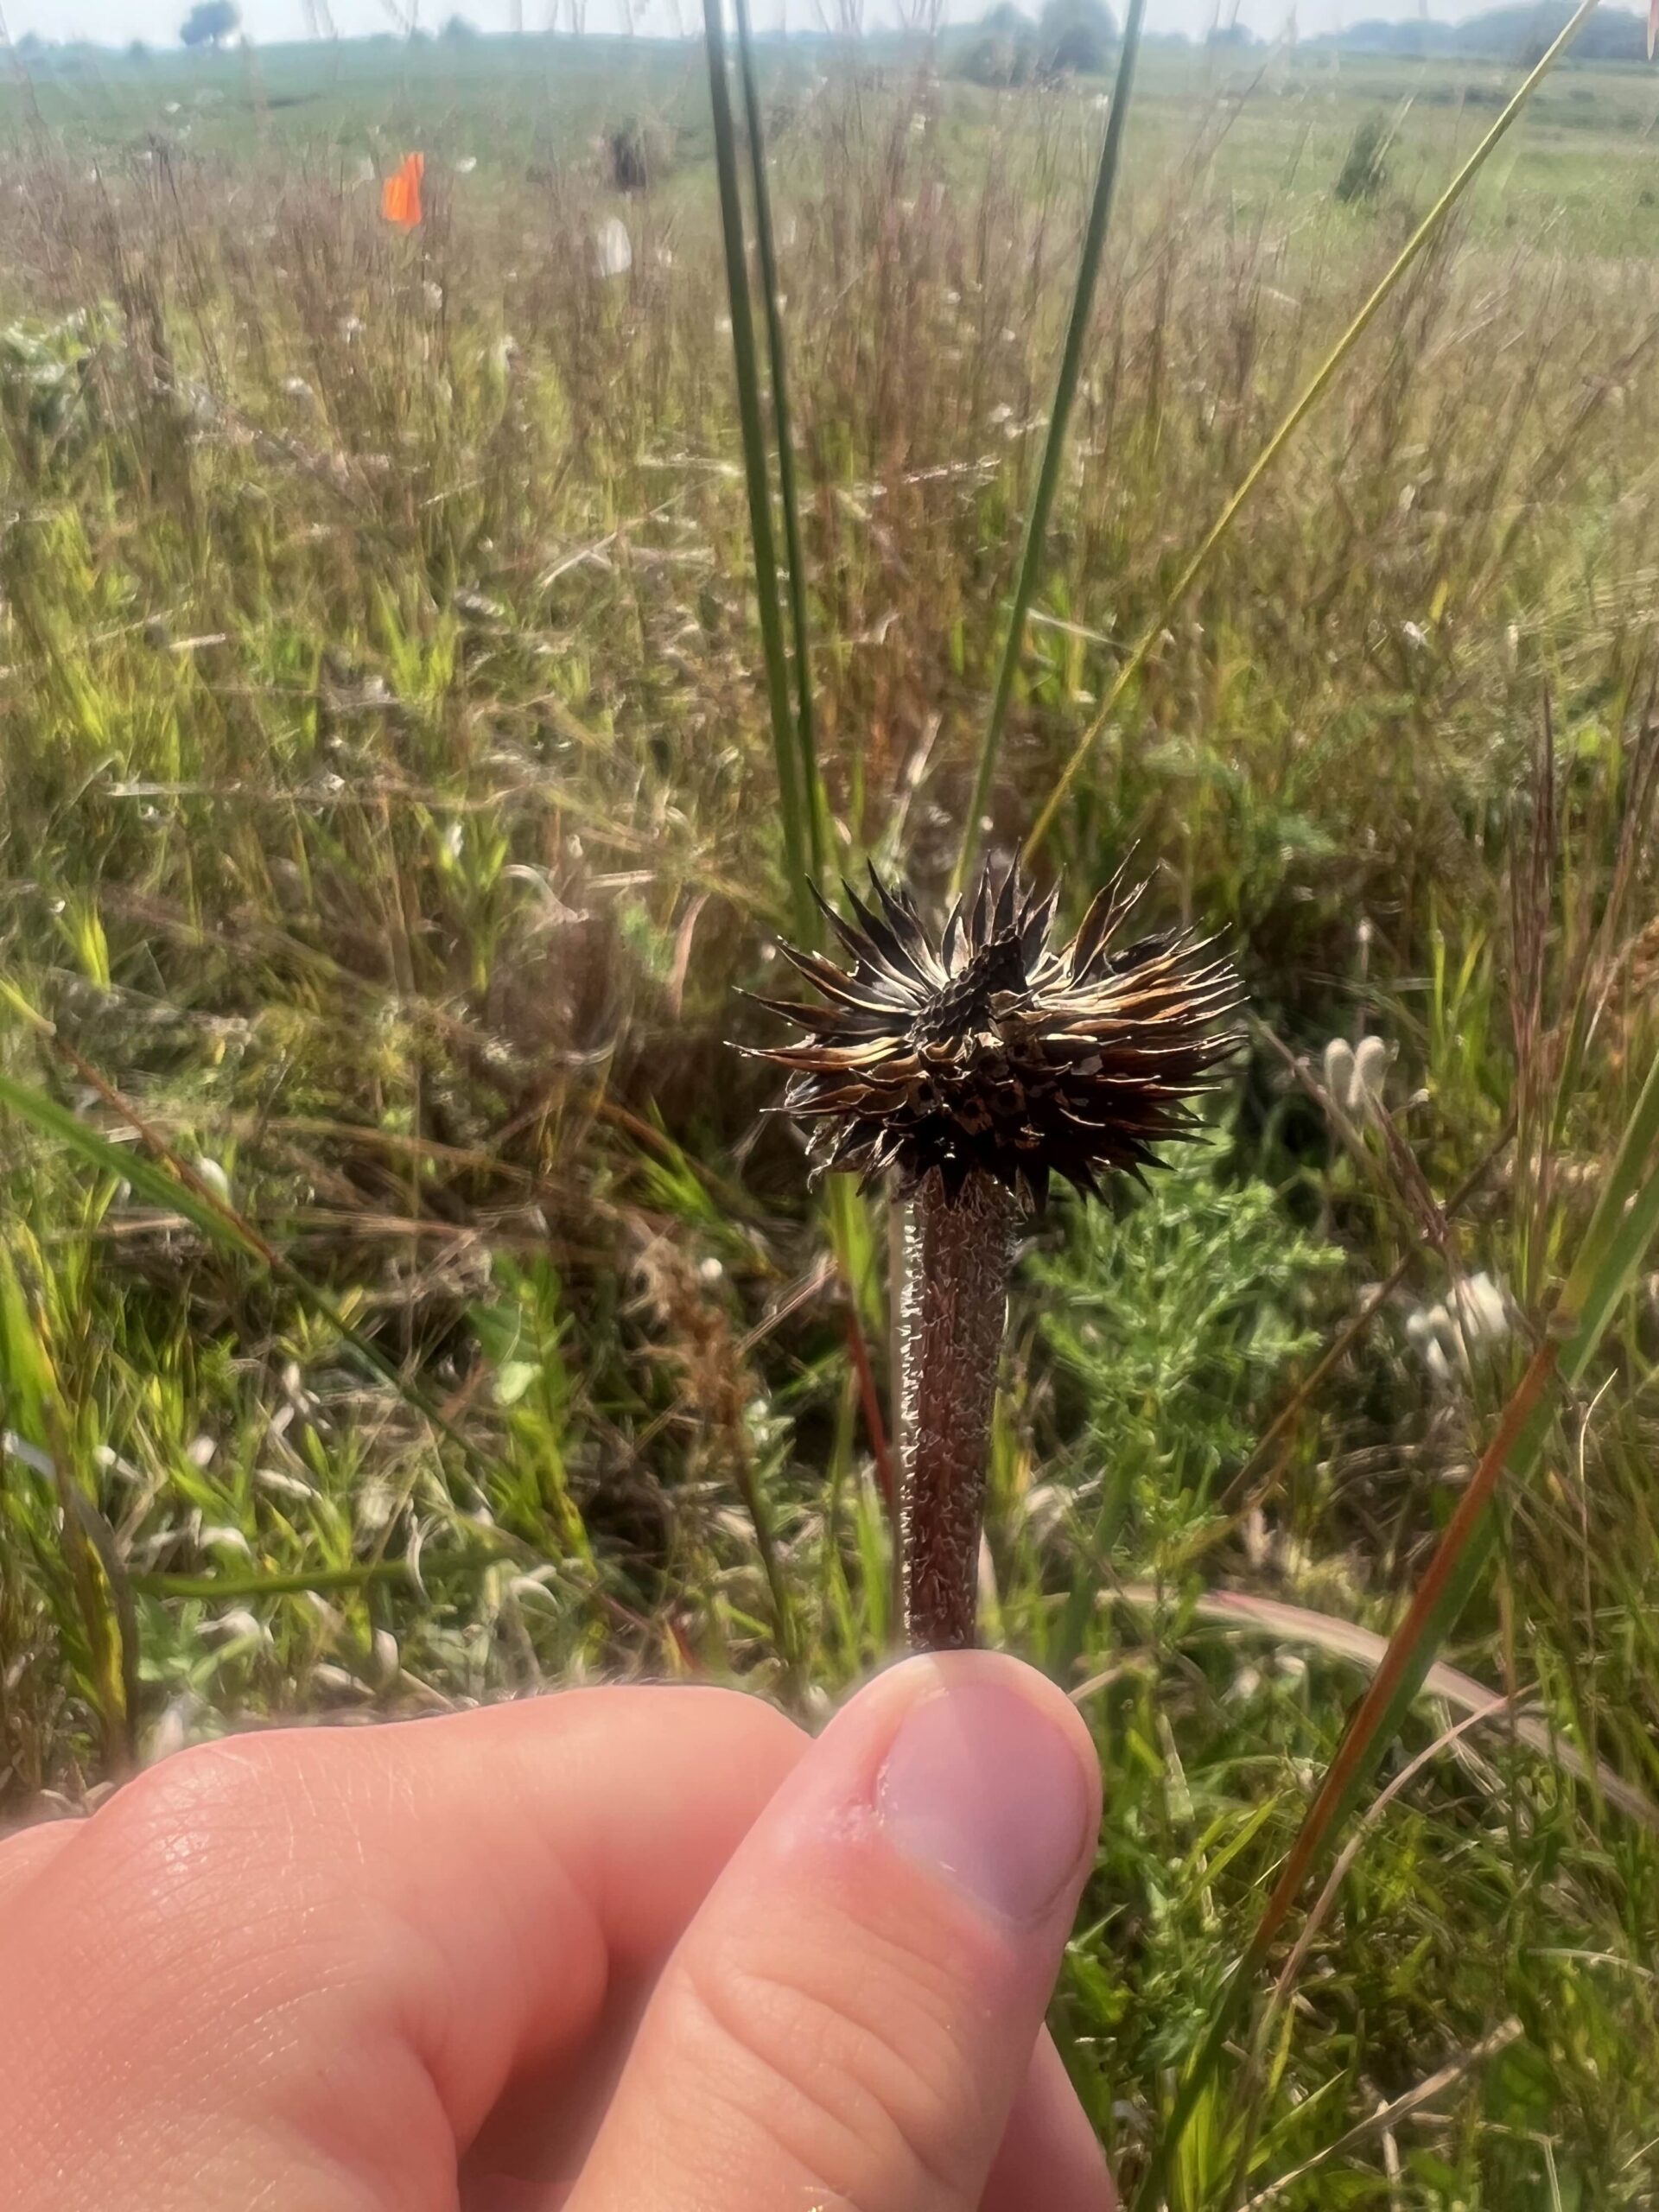
Our first harvest was at p2, p7, and p9 on August 19th. Our last harvest was all the way on October 3rd at p7 and p9! Those hybrid plants really held on for awhile. Unfortunately, our first harvest was not in time to harvest some heads before they begin dispersing, and there are always a couple that lose achenes throughout the harvest season before we catch them. This year wasn’t toooo egregious, but our worst head lost an estimated 85% of its achenes before we encountered it. Yikes! Keep an eye out for seedlings around (7, 2) in p2…
A few achenes shy of a full head…
One major victory from this year is that, besides a couple holes and piles of dirt, the ground squirrels were relatively well behaved in p2 this year. Typically, they enjoy ripping heads off echinacea plants and leaving stems, heads, and achenes everywhere. Based on harvest notes, in 2024 we only found two heads on the ground and only one was missing entirely. Compare this to 2022, when the team only harvested 41% of the heads they planned on harvesting due to ground squirrel activity. (Though, I suspect this may have been a blessing—they still harvested 480 heads. If they’d harvested all of them, it would have been around 1,170 heads. That’s a lot of harvesting!)
Another fun fact: The 99 south garden in p1 produced 25 heads this year, but its 99 north counterpart didn’t have a single flowering plant.
Additionally, we did visit p5 this year and found several flowering (and some basal) plants, but were instructed not to harvest them, so we didn’t.
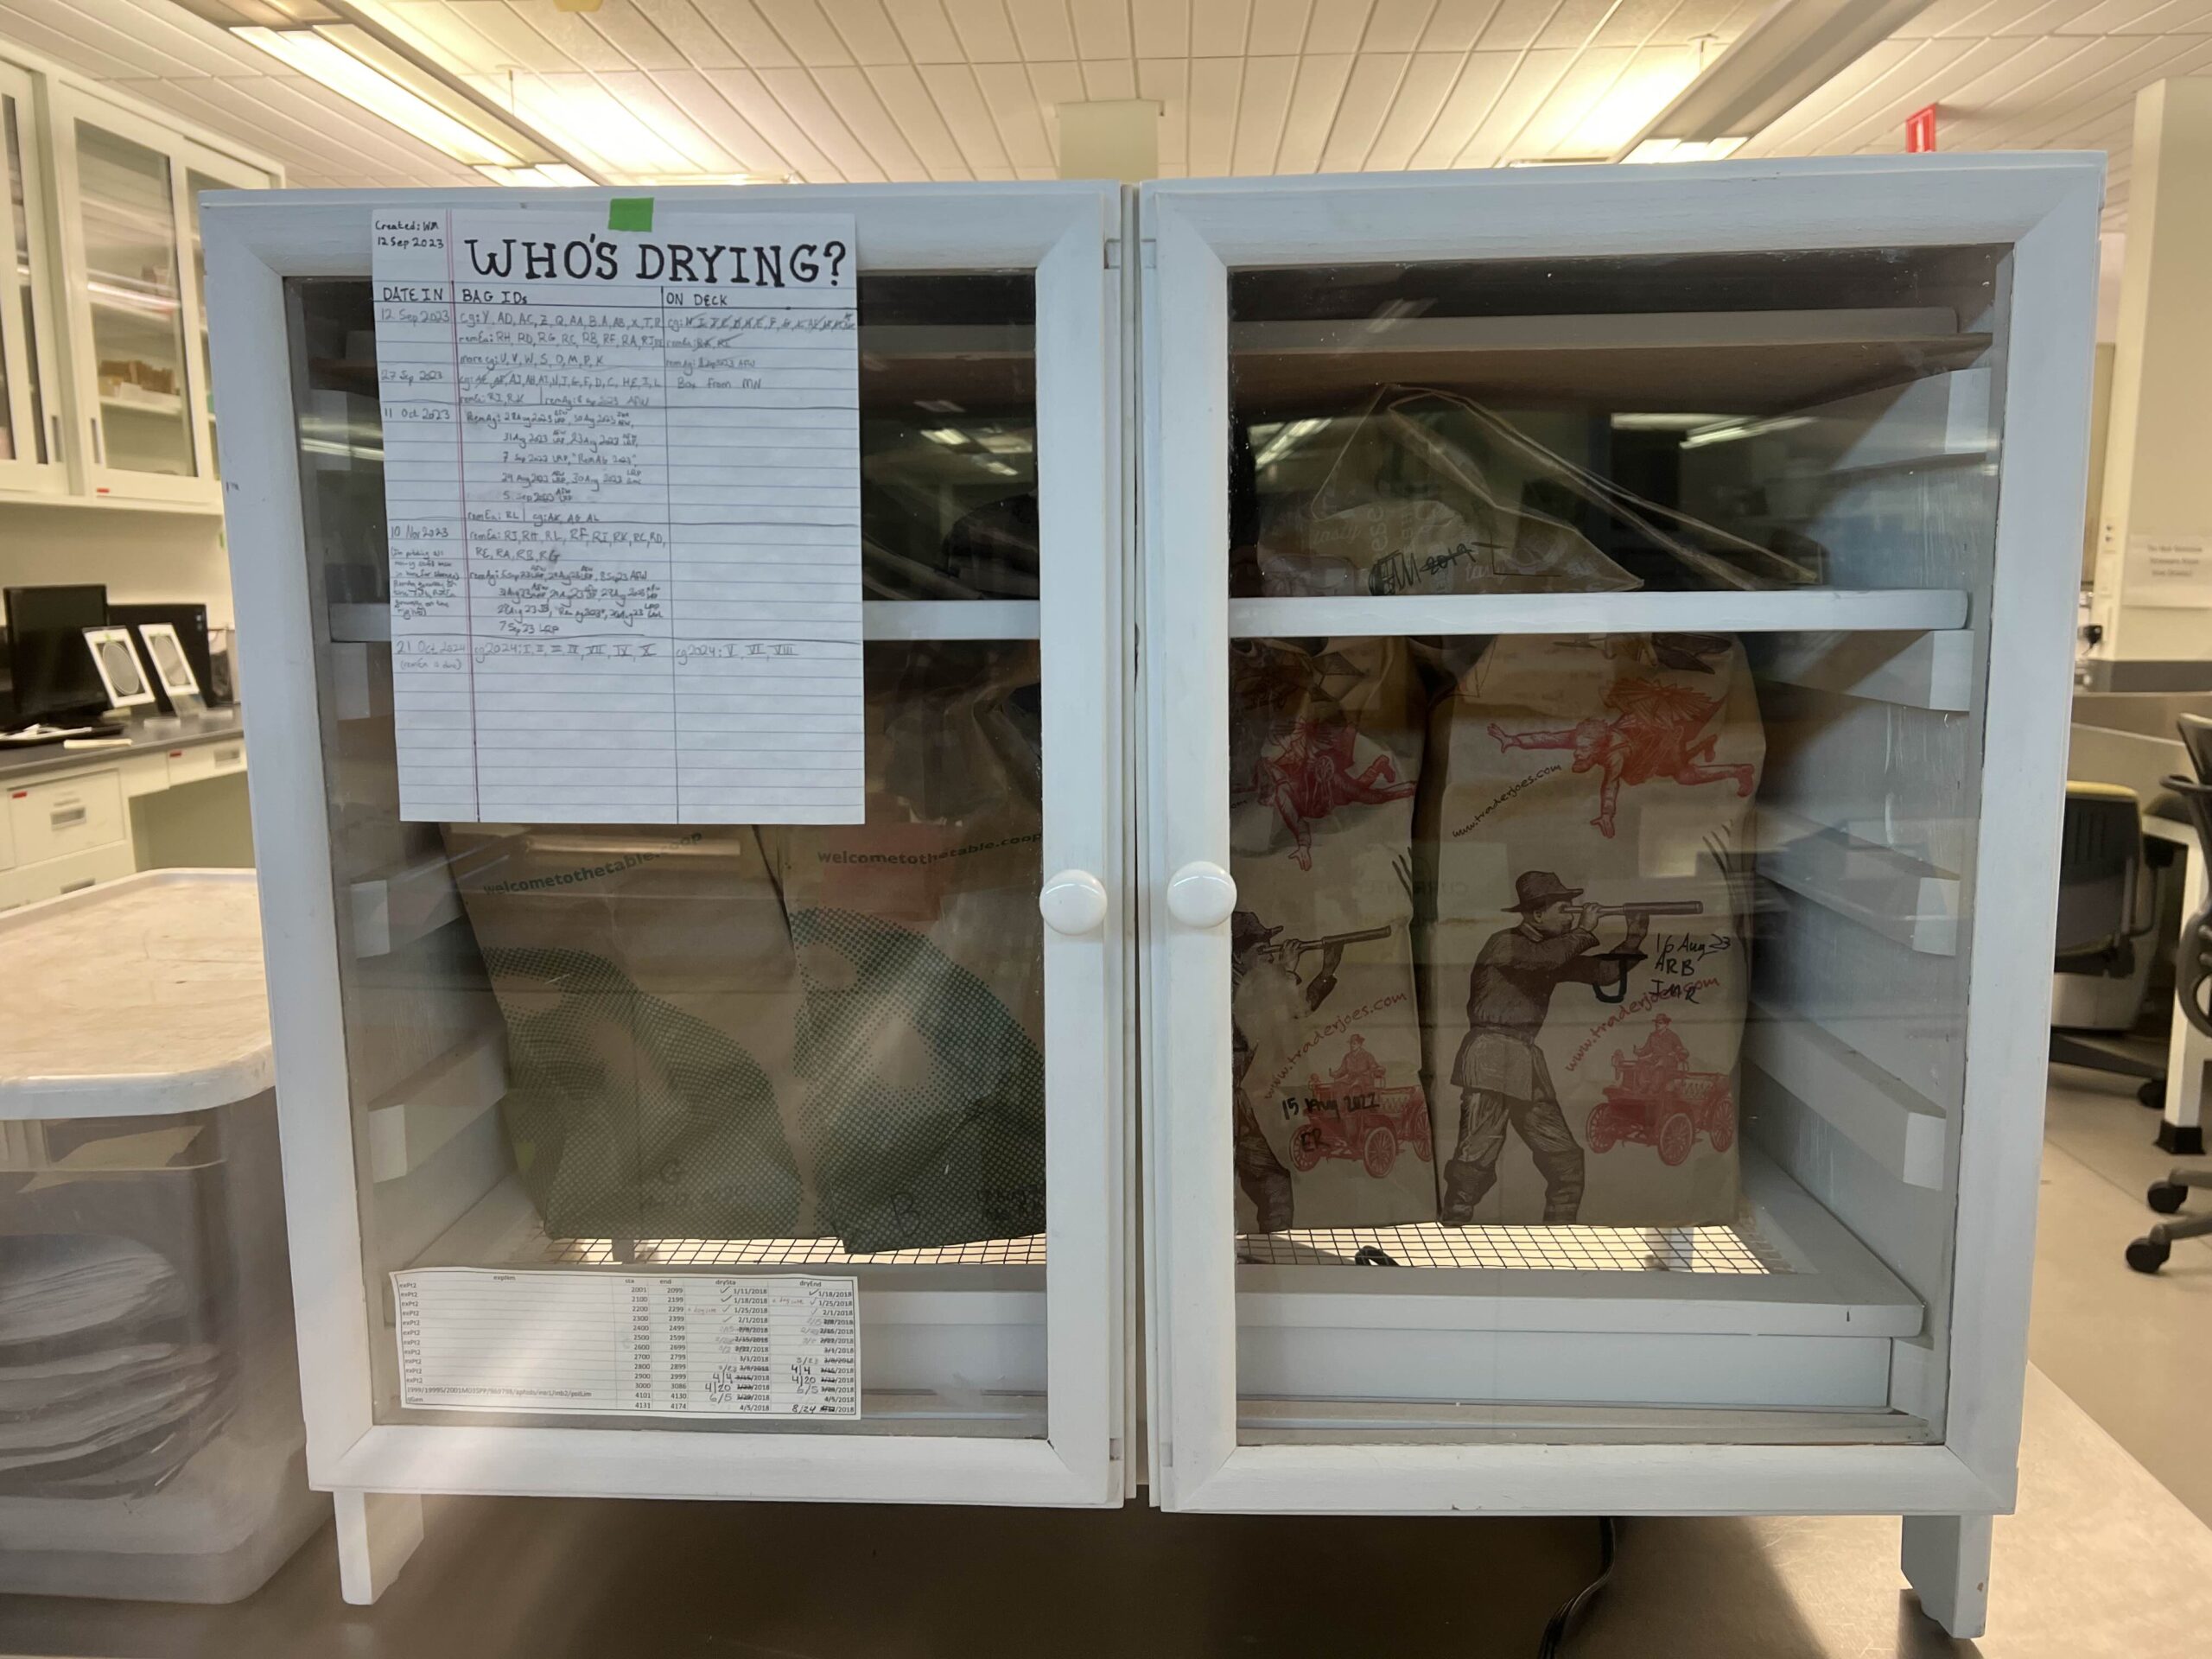
cg heads in the seed dryer prior to going through the ace process in the lab. It isn’t every year when almost all of your gBags fit in the seed dryer at once! I bet I could’ve made em all fit if I really squeezed them, but what’s the rush?
We still have a couple of gBags from 2023 to clean, plus 10 from this year. We like keeping our volunteers stocked! We’ll send exPt01 2024 through first, just after the remnant heads. And so the cycle continues!

